Use case #3 Influencer Campaign Attribution in Paid Media
A brand manager at Ingka is running a campaign that combines influencer content with paid media to boost reach and engagement. The media team wants to integrate influencer touchpoints into attribution models to understand their role in driving conversions. The journey unfolds in three key steps:
Step 1: Ingka’s brand manager is running a campaign that includes influencer collaborations supported by paid media. They want to understand whether influencer content is driving traffic, conversions, or both, and how its performance changes when amplified through paid channels.
Step 2: A media team member works to ensure influencer content is not treated as a siloed tactic. The team integrate influencer touchpoints into the broader media attribution model, allowing the team to see how influencer content contributes for upper, mid and lower funnel campaigns.
Step 3: The team makes sure that partners with the brand have the possibility to produce authentic, engaging content. They want their work to be valued not just for reach or impressions, but for its actual impact on brand outcomes such as engagement, consideration, and conversion. With better attribution, their contribution is more transparently recognized
Use case #3 build-out
As you have already seen, there are different approachs to get to a point, we can filter the whole panel building a ‘Quick Filter’
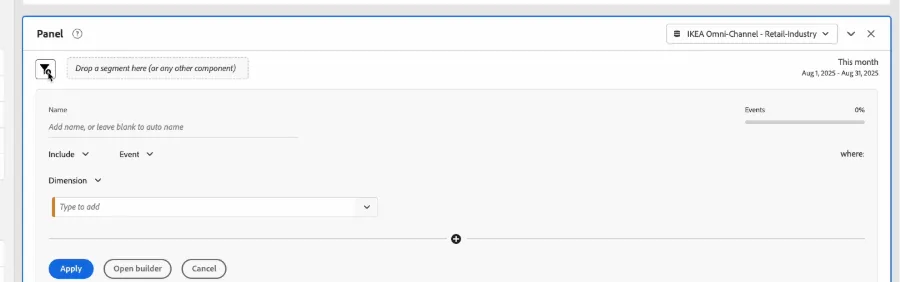
And selecting the dimensions, metrics or date ranges we need for our analysis, like we may do to get the panel filtered by a quick segment for Traffic Impacted by Influencers + Paid Social in this example, or a campaign filter.
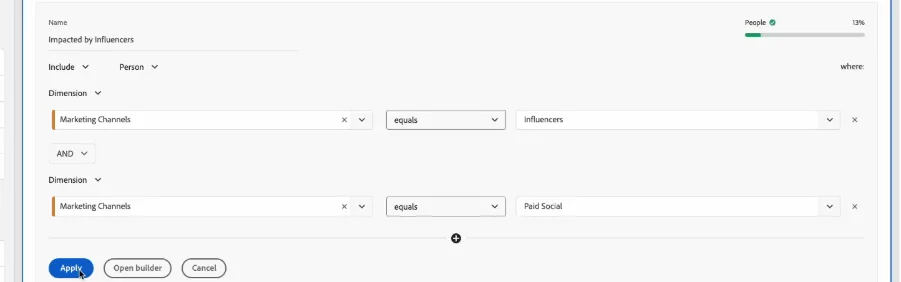
We can also create individual segments, as we have done previously.
For this #3 use case, we need to create two new segments: People Impacted by Influencers, and another one for People Impacted by Influencers AND Paid Traffic
For the People Impacted by Influencers AND Paid Traffic segment we can re-use the segment we have used to create the first panel IKEA's OMNICHANNEL KPIs, the one called ‘Paid Traffic’.
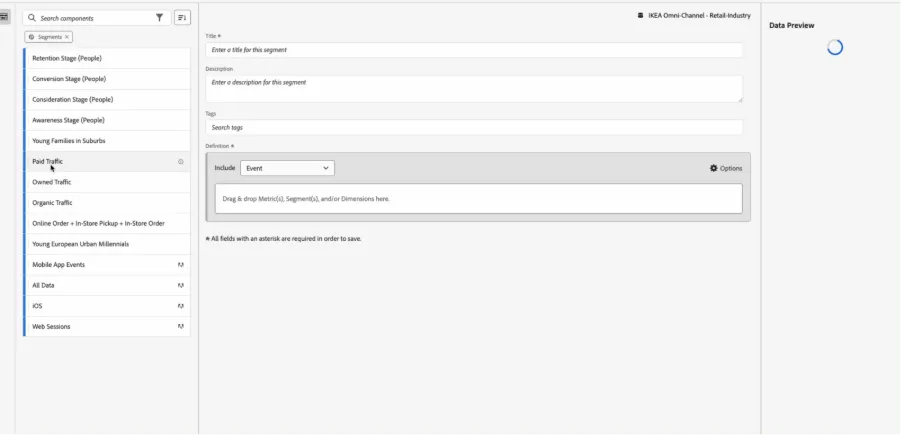
Add the Marketing Channels dimension to filter by ‘Influencers’:
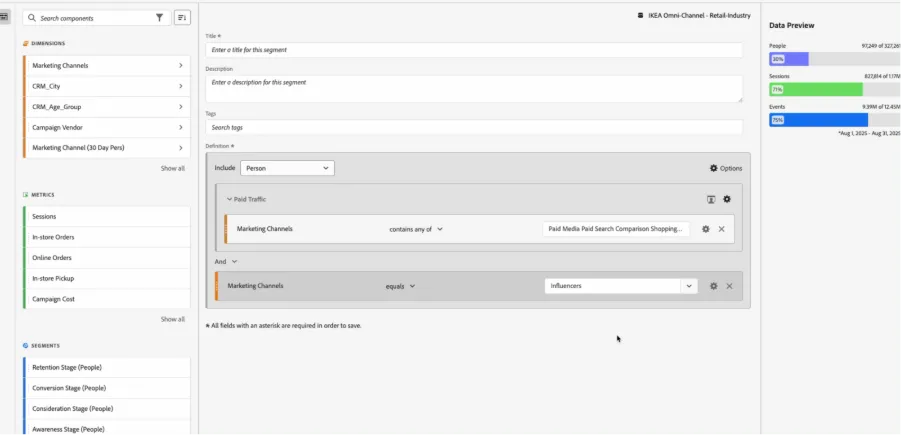
We changed also the scope of the segment to: Person and put a new Title for the Segment:
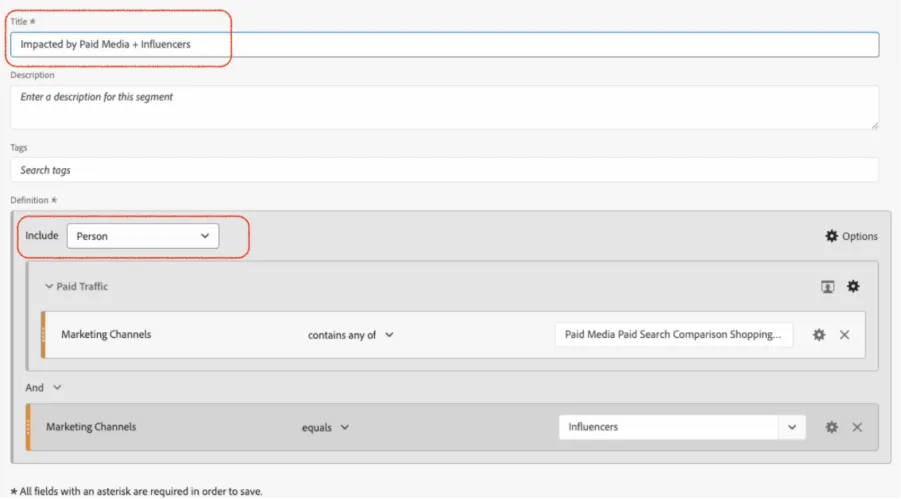
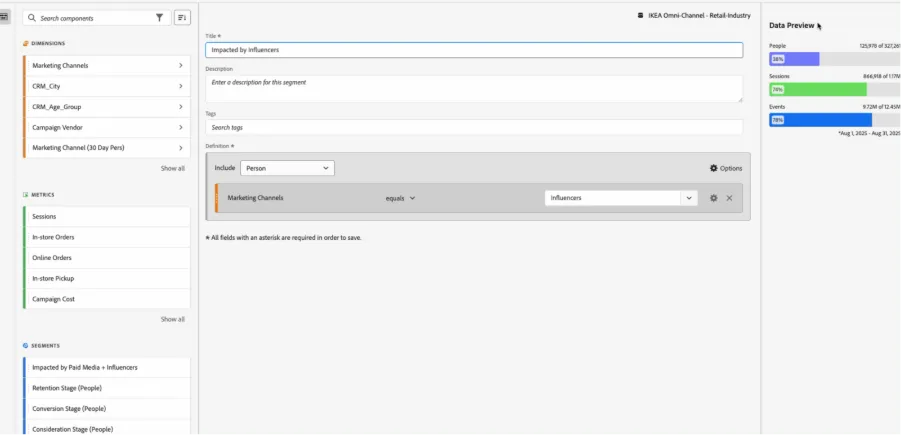
We want to create also a segment of people impacted just by Influencers, so we create a new segment called ‘Impacted by Influencers’
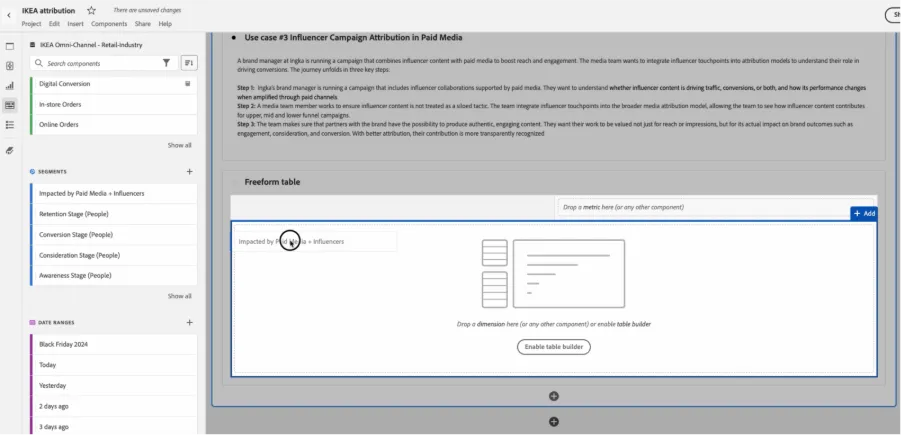
Now we add the new segment ‘Impacted by Paid Media + Influecers’ into a freeform table to start our analysis:
And we do the same with the ‘Paid Traffic’ Segment
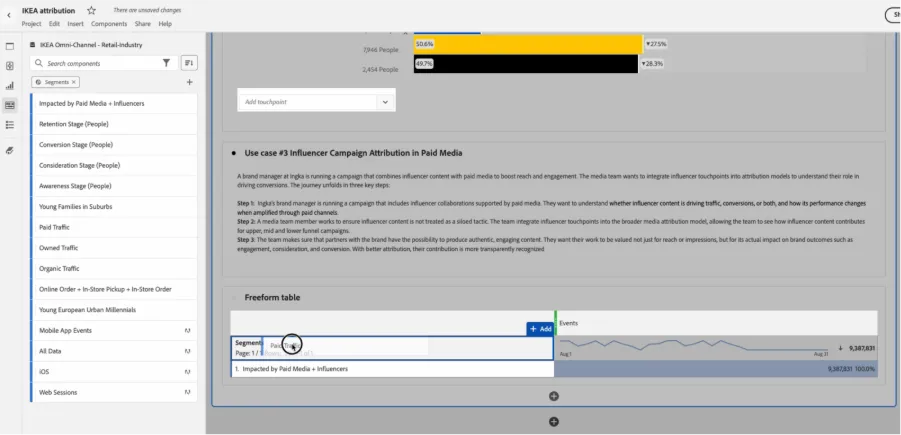
And then add the ‘Impacted by Influencers’ segment:
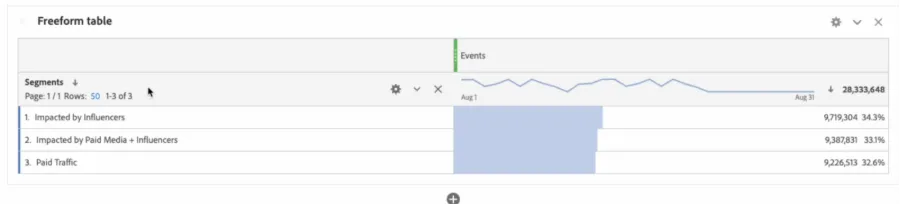
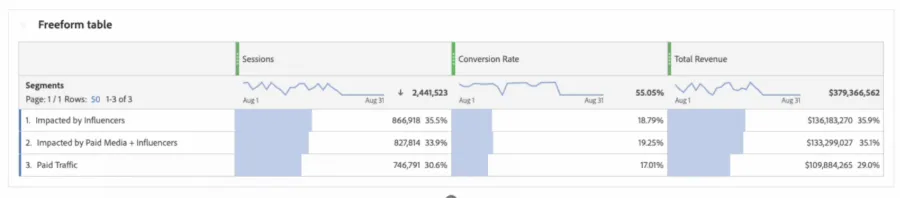
Now we replace the Events metric by Sessions metric, and we add to ‘Conversion Rate’ and ‘Total Revenue’:
We are going to keep doing a more granular analysis, so we want to analyse the segments of people impacted by channel, by the stage of where they are.
To do this, we filter first the metric Sessions by the segment Awareness Stage (People)
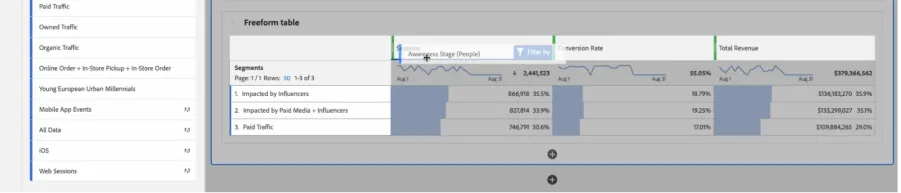
If we want to compare the performance of these impacted users by their customer stage, we need to add the Session metric two times more to filter by the Consideration Stage (People) and Conversion Stage (People):
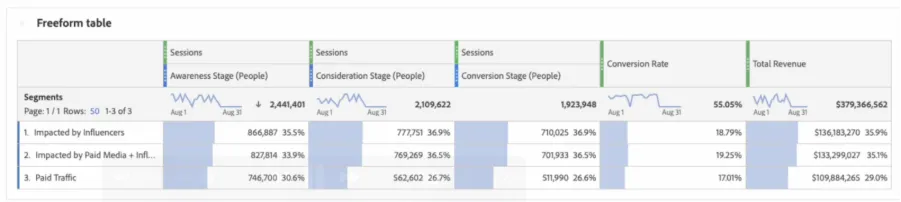
Please notice that the exact values that we see in this screenshot may change depending on the date range used.
Key Takeaway
From our demo data, now we have a detailed view where we can see that Influencer marketing (with or without paid support) is outperforming pure paid traffic across all funnel stages and delivering higher revenue. We may not need to amplify Influencers investment with paid media.
As we explained earlier on the section Attribution in AEP, there are different approaches when it comes to attribution.
On the one hand, we may want to answer questions about the impact of a channel or campaign on metrics such as sessions or conversions. As we have done for this use case.
On the other hand, we might want to predict how our ROI would improve if we invested money in different channels, supporting each other at the campaign level. In this case, it is not enough to analyse customer touchpoints; we must apply marketing mix modeling attribution models in conjunction with touchpoints to plan and evaluate meaningful metrics such as incrementality or the break-even point at which we begin to see a decline in advertising ROI. To do that, we must use Adobe Mix Modeler.