11. Reporting & Monitoring (DEMO)
In this section, your facilitator will walk through a pre-built Customer Journey Analytics (CJA) dashboard for the LF Mortgage experience, showing how content, channel, and experiment performance can all be monitored from one place.
Publishing content is only half the job, LF also needs to know whether it's actually working: which channels customers use, where they drop off in the mortgage journey, and whether a personalized or experimental variant is actually performing better than the original.
This step is presenter-led rather than hands-on. Rather than build a dashboard live, we're using a real, pre-generated CJA report so you can see genuine data patterns, including an actual A/B test result from the Experimentation step earlier today.
Objective
Walk through a pre-built CJA dashboard covering channel usage, page and journey performance, funnel drop-off, customer cohorts, and A/B test results for the LF Mortgage experience.
What This Proves
- Customer behavior and performance can be monitored in real time, across channels
- Funnel, path, and conversion analysis are available out of the box
- Content and page performance can be analyzed by audience and channel
- A/B test results feed back into the same reporting layer as everything else
- Reporting connects directly back to the content and experiences built earlier today
Customer Journey Analytics
Open CJA at Workspace
Key KPIs
Freeform Table (People, Sessions, Events by channel)
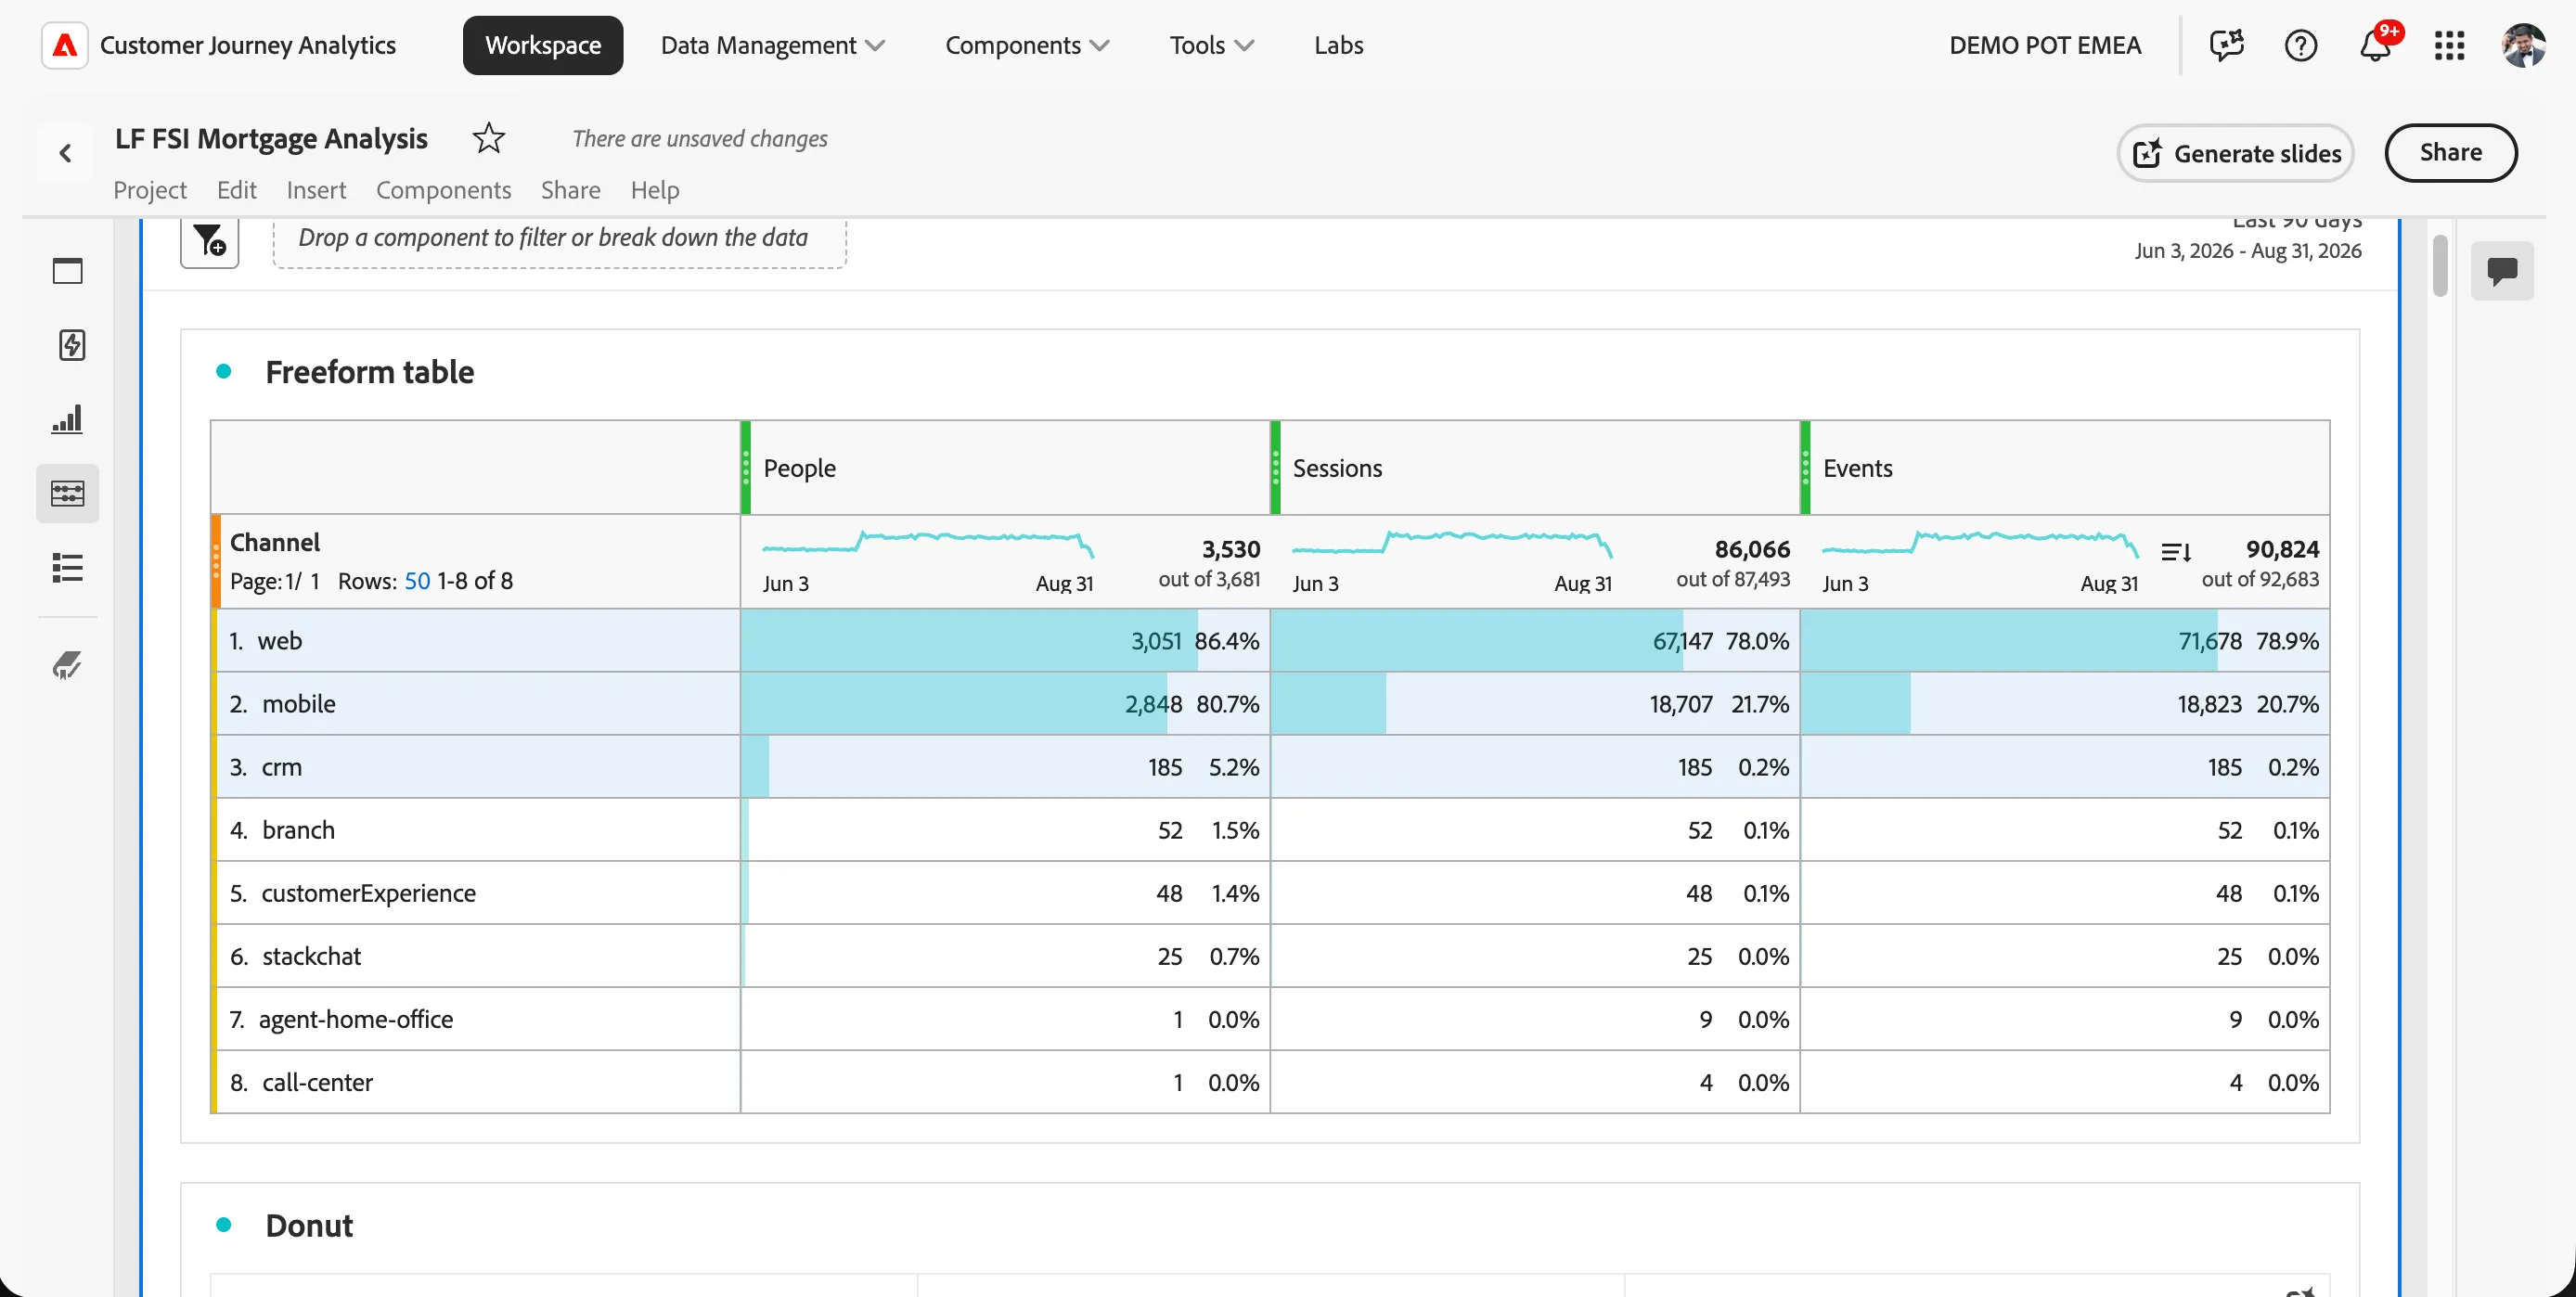
This table breaks down every visitor, session, and interaction by the channel they came through, web, mobile, CRM, branch, customer experience team, chat, and call center. In this 90-day window, web and mobile together account for over 99% of all activity (86.4% and 80.7% of people respectively), with assisted channels like branch and call center making up a small but real slice.
Why this matters for LF: this confirms the mortgage journey is overwhelmingly self-service and digital, exactly where the CMS/DAM work from today has its impact. It also tells LF where not to over-invest reporting effort, the assisted channels are a small fraction of volume.
Donut Chart (channel split)
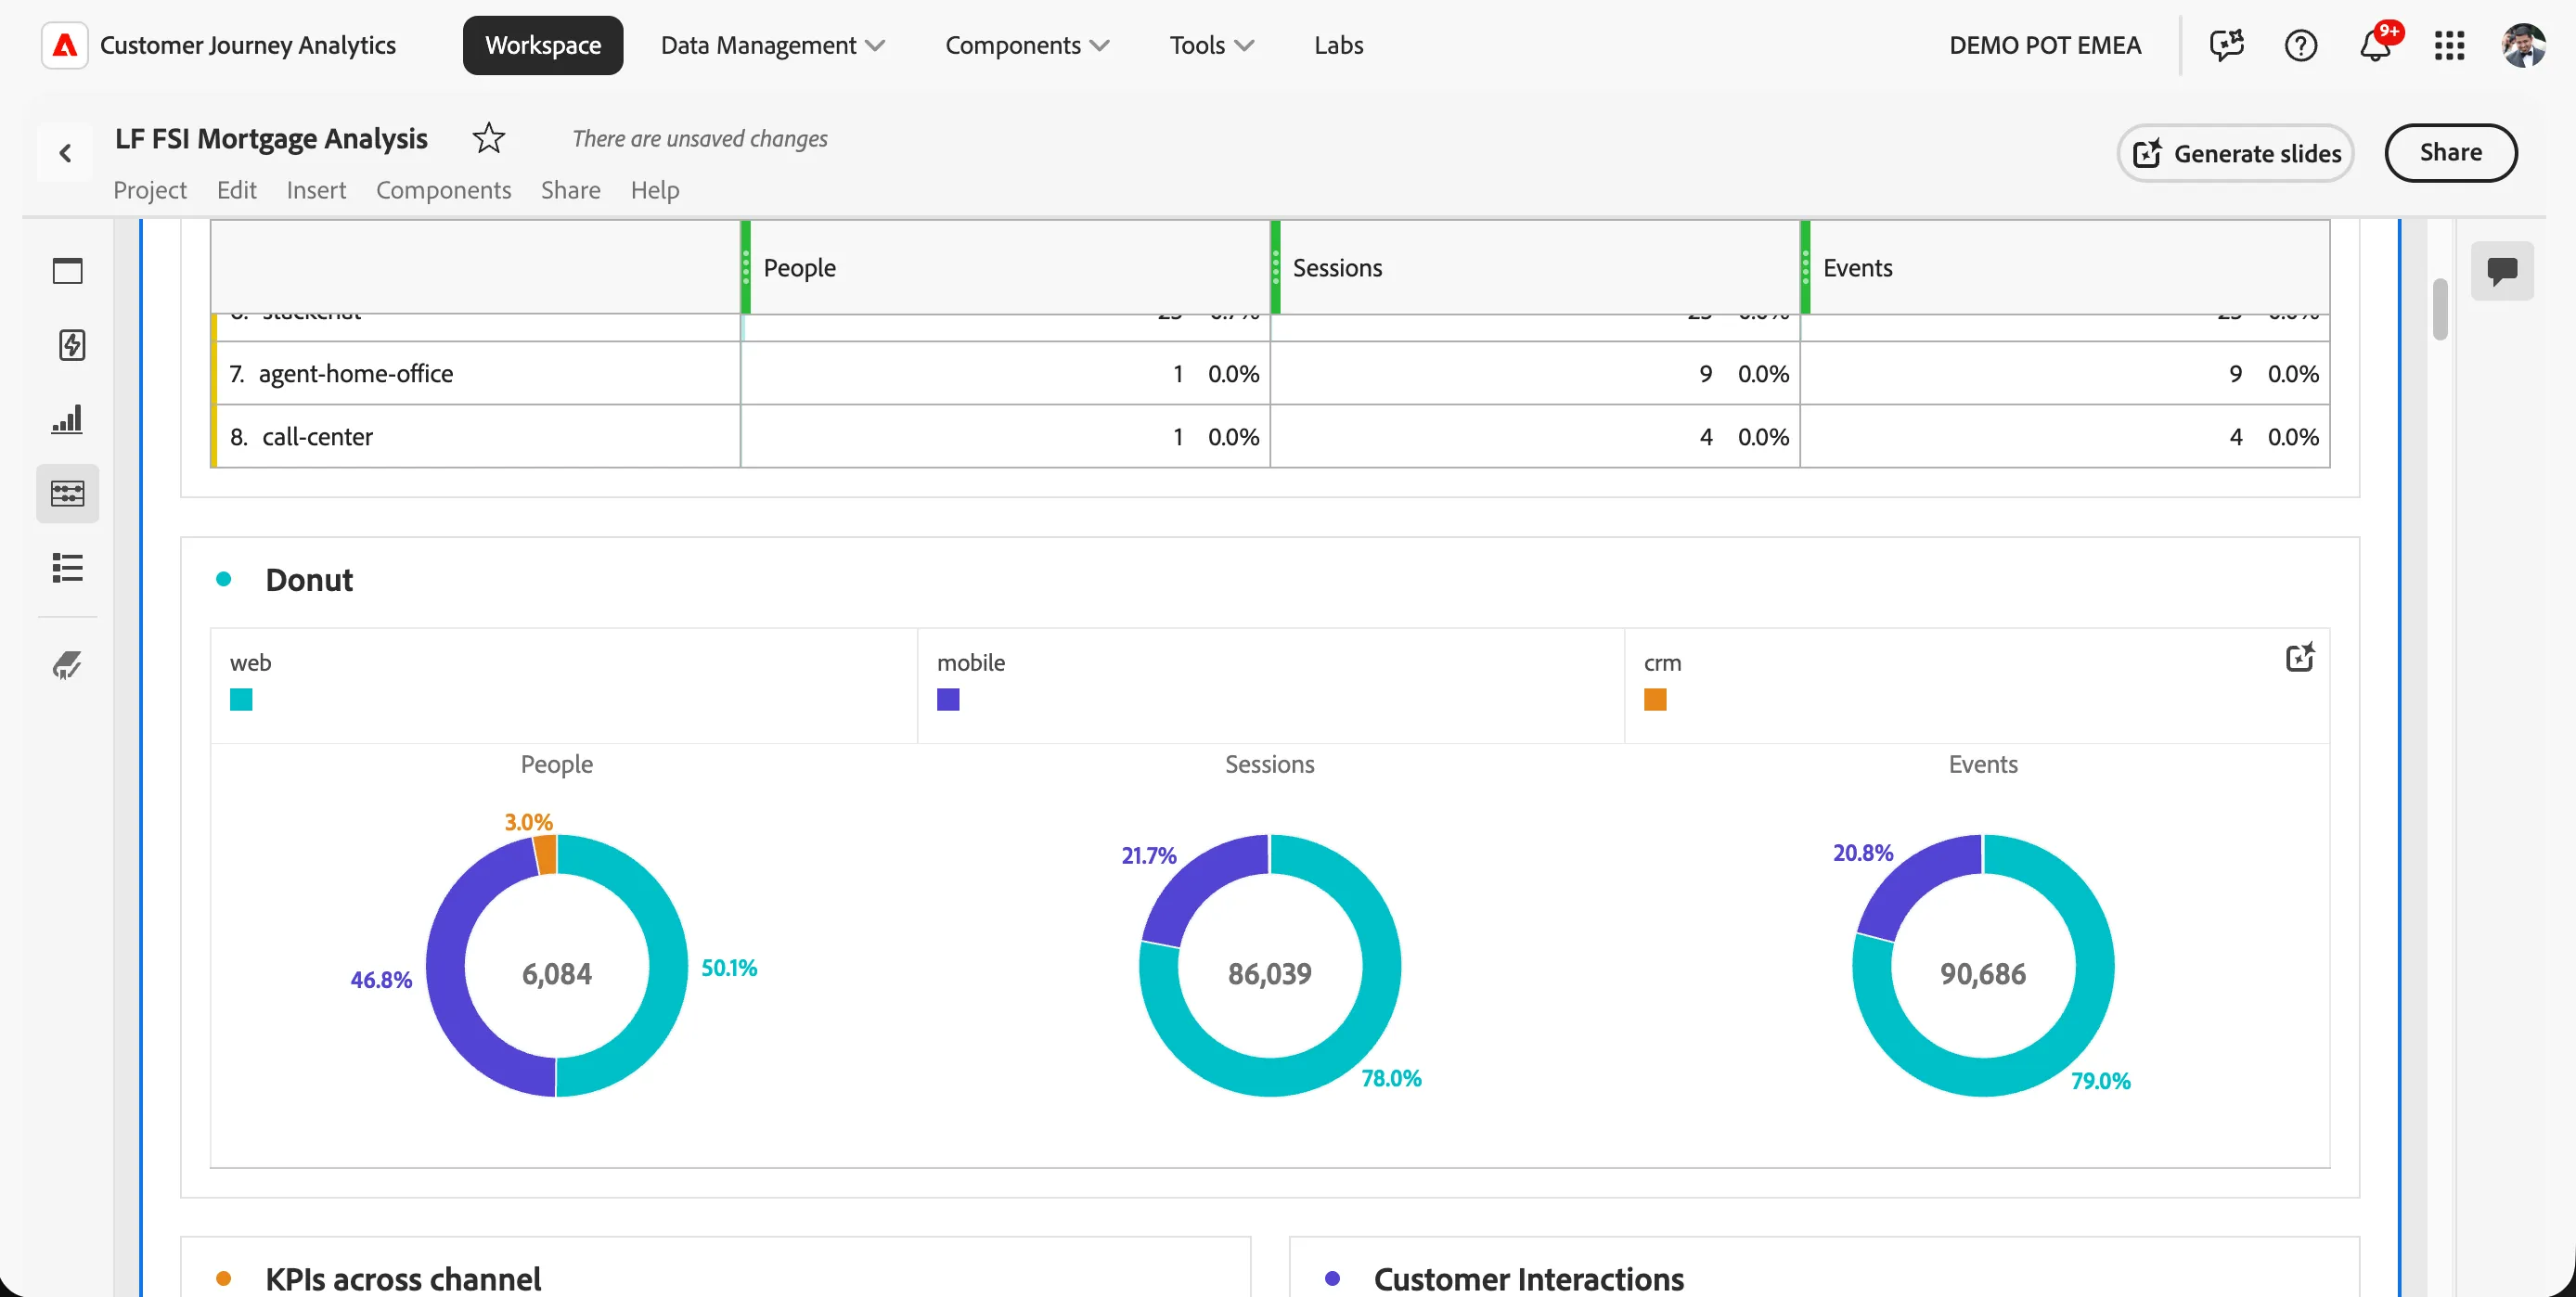
The same data visually, web and mobile split the majority of traffic almost evenly, with CRM, branch, and other assisted channels forming a thin remaining slice.
KPIs Across Channel (Call center dial-ins)
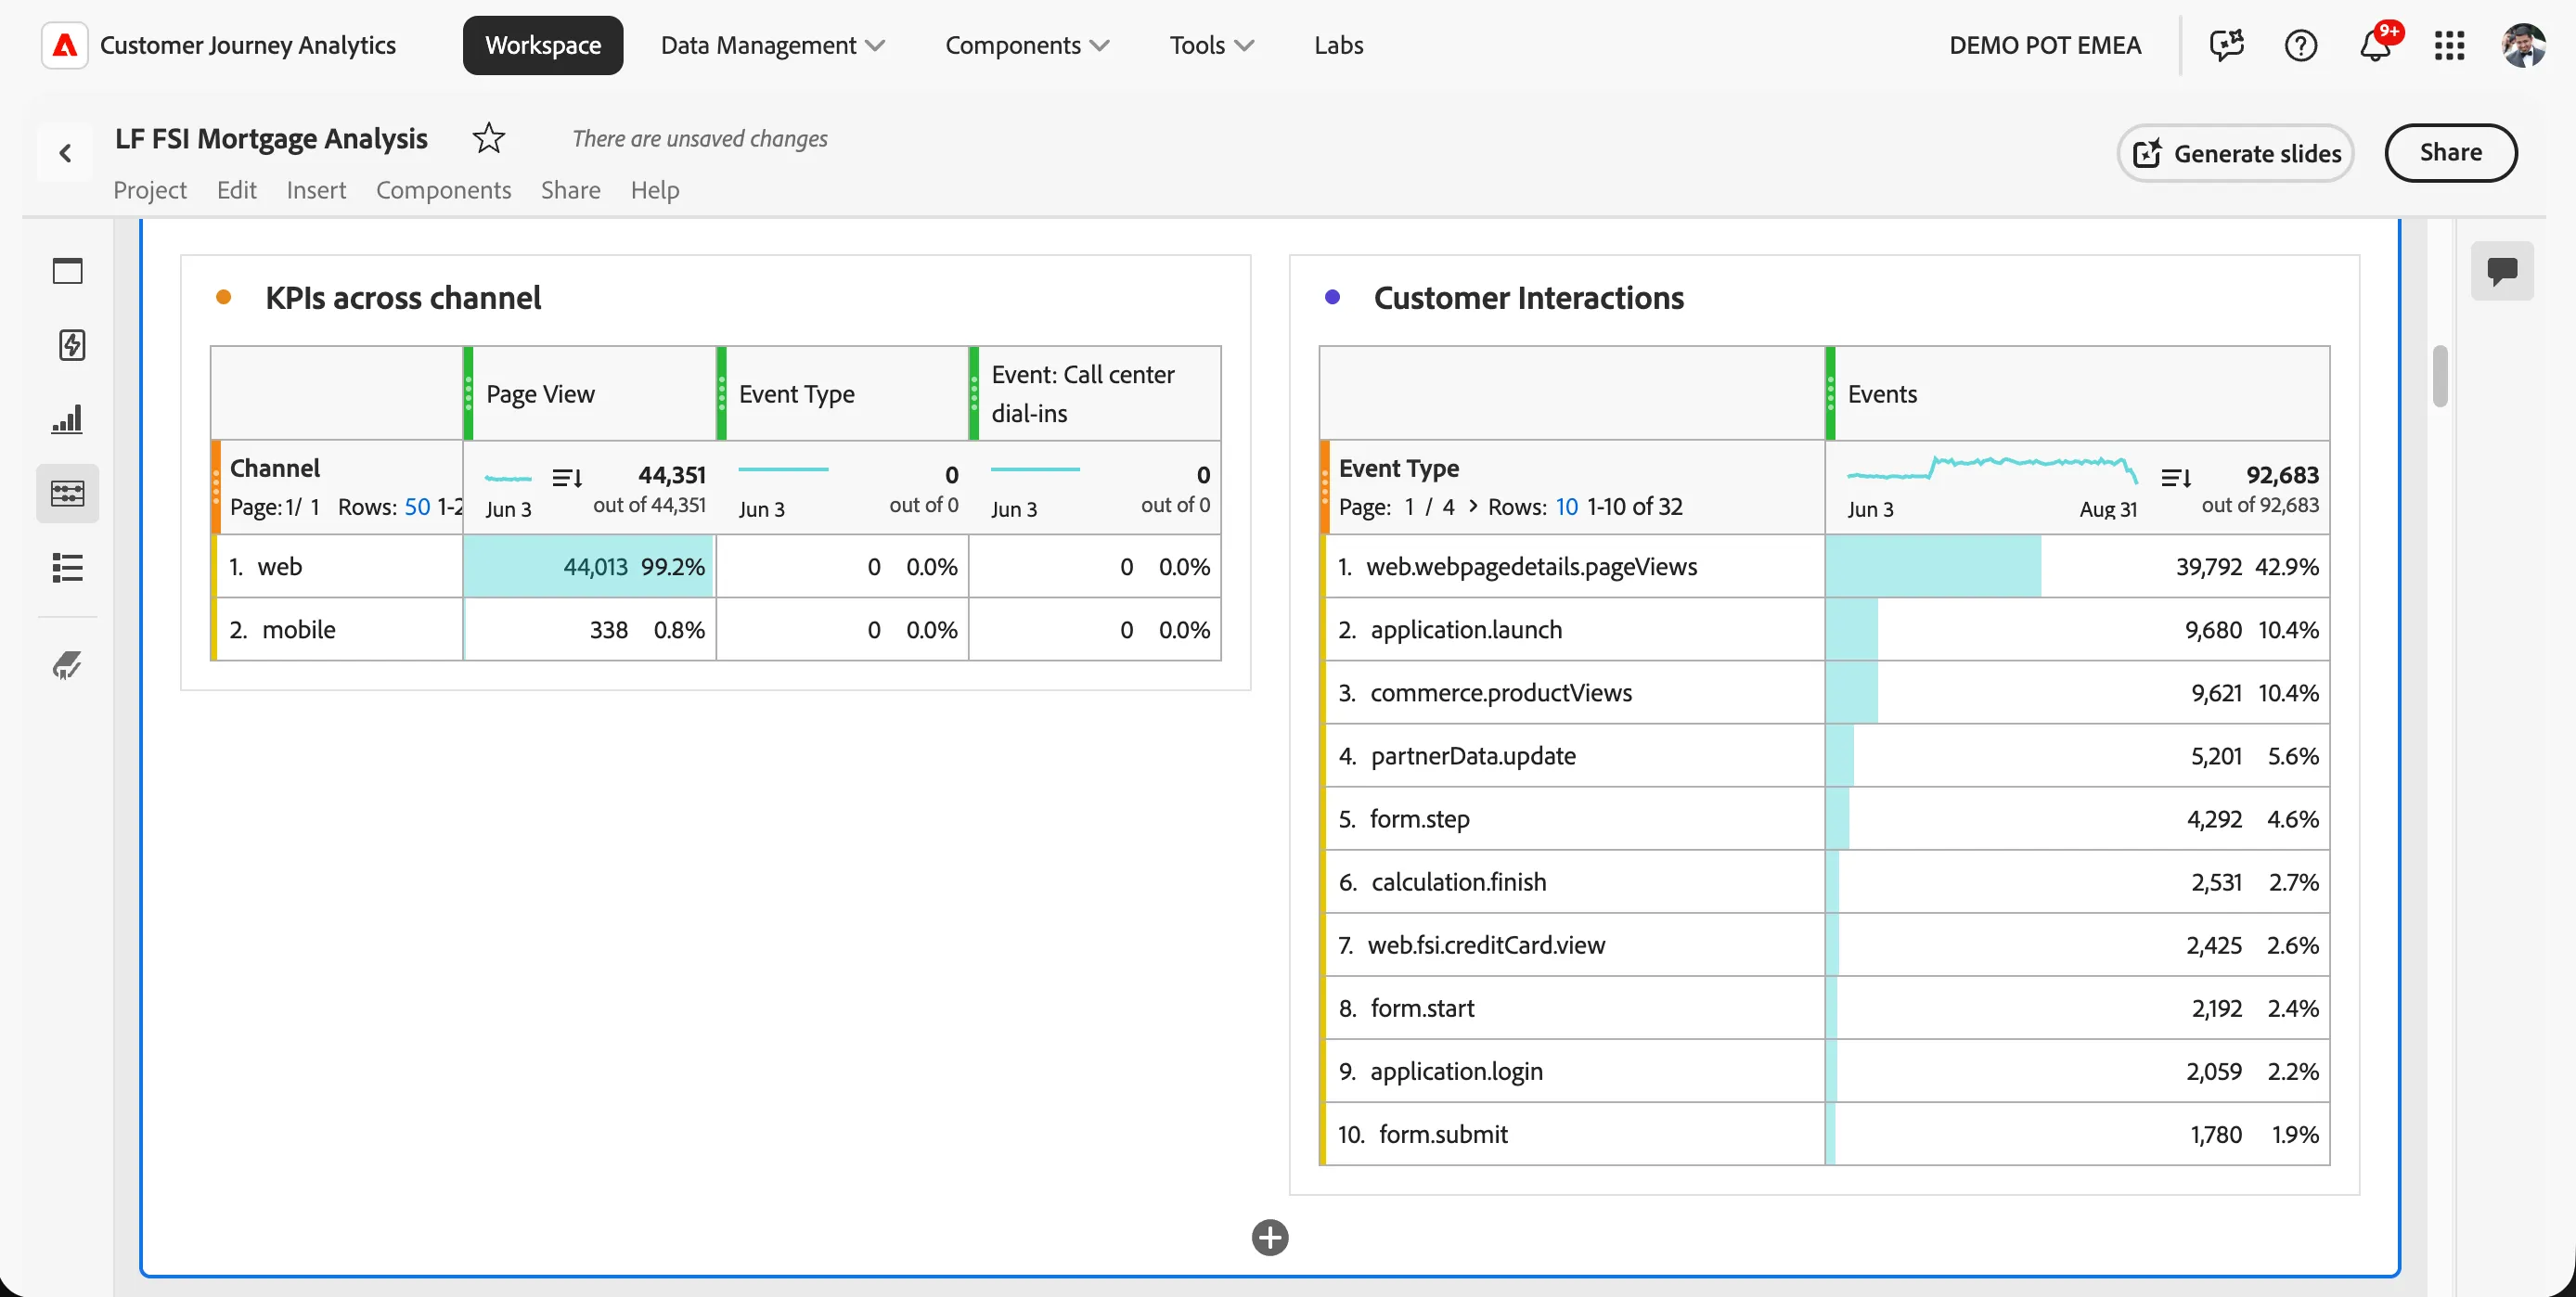
A secondary table showing call center-specific interactions, 44,351 dial-in events, almost entirely attributed to web (99.2%). This is a good example of cross-channel attribution, a call center event still gets tied back to the digital channel that originated it, giving LF a fuller picture than looking at call center data in isolation.
Customer Interactions
This breaks down the 92,683 total events by type, page views lead (42.9%), followed by application launches, product views, partner data updates, form steps, and, notably, calculation.finish (2.7%) and form.submit (1.9%), two of the most business-critical events in the whole mortgage journey, since they represent someone actually using the calculator and completing an application.
Cross-Channel Analysis
Page Analysis
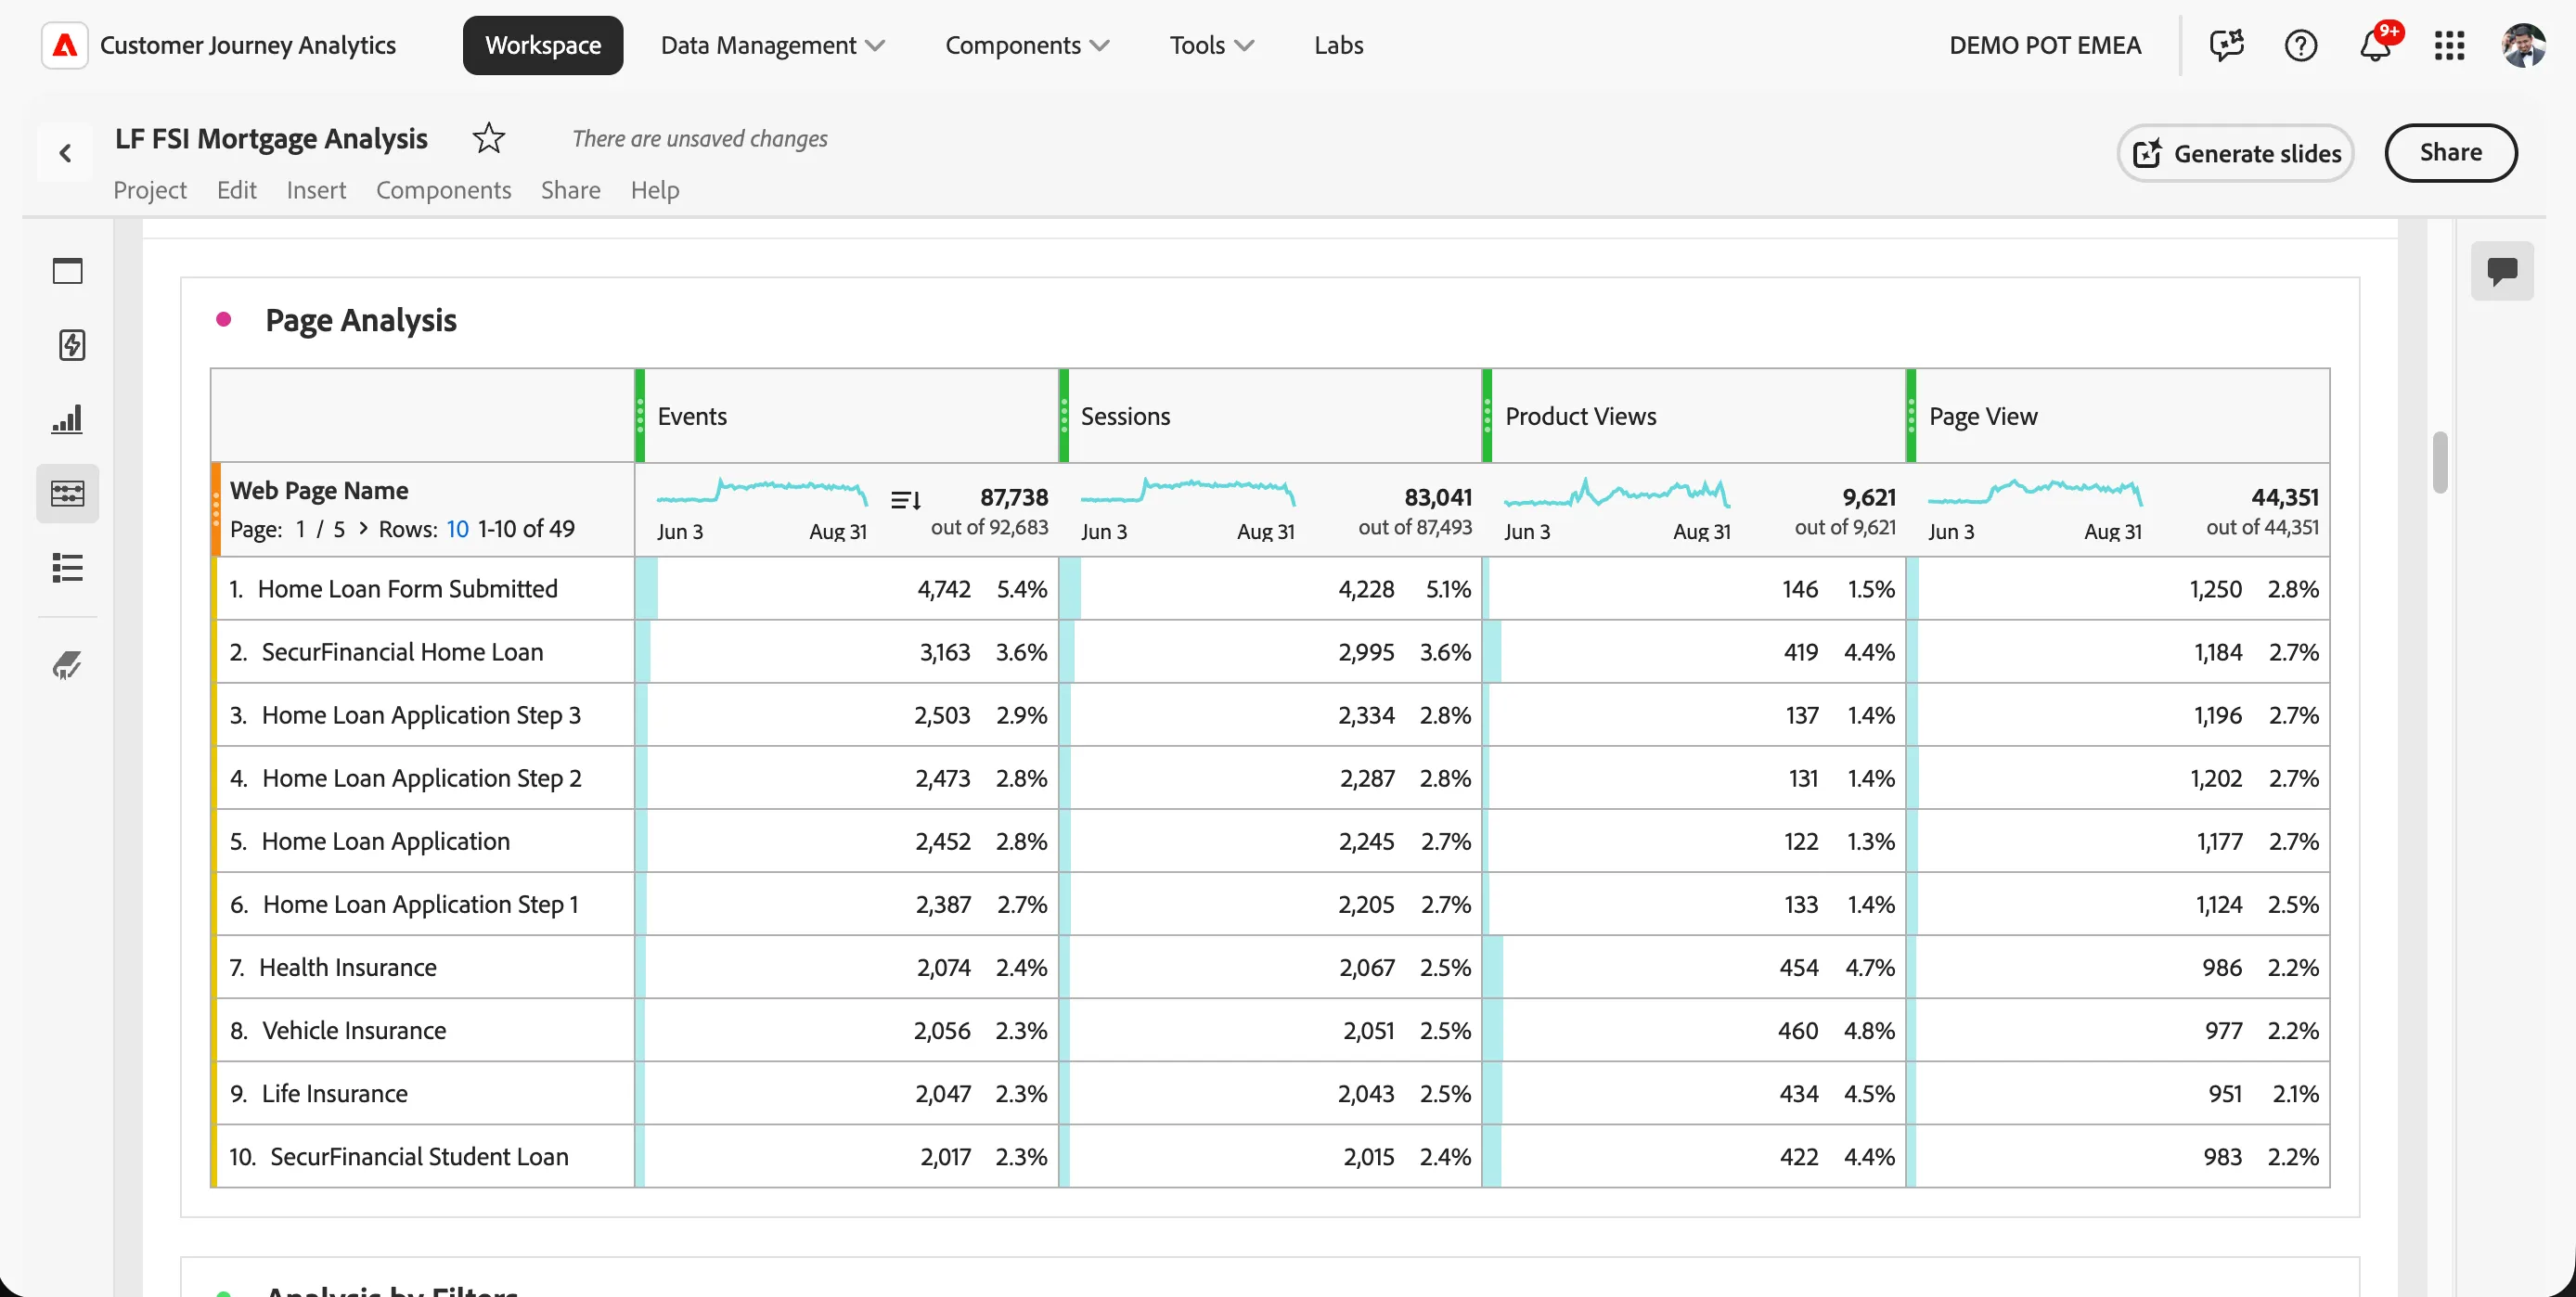
This table ranks the top pages by events, sessions, product views, and page views. The Home Loan Form and Home Loan Application pages dominate the top of the list, alongside insurance product pages (Health, Vehicle, Life) that also draw meaningful traffic, useful context for LF on which products compete for attention alongside the mortgage journey on the same site.
Analysis by Filters
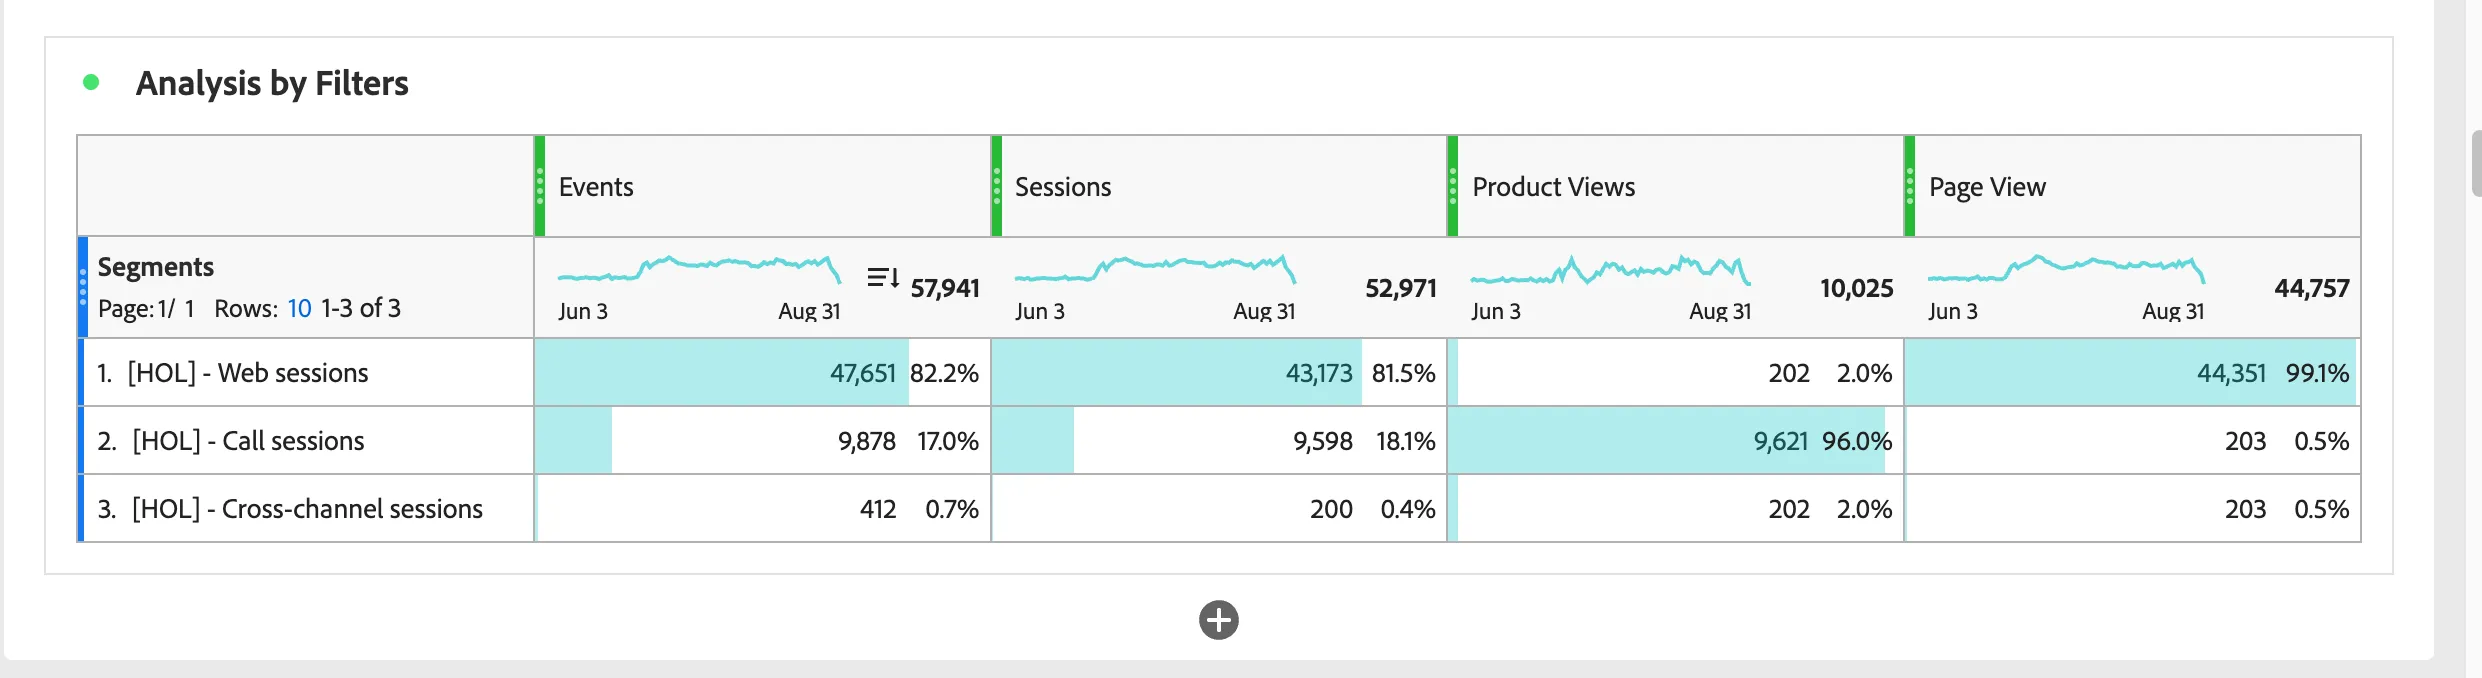
This segments all activity into three pre-built groups: web-only sessions (82.2% of events), call-only sessions (17.0%), and true cross-channel sessions that touch both (0.7%). That small cross-channel segment is disproportionately valuable to watch, since it represents customers who move between digital and assisted channels during the same journey, often a sign of friction or a complex need.
Journey Visualisation
Page Flow Analysis
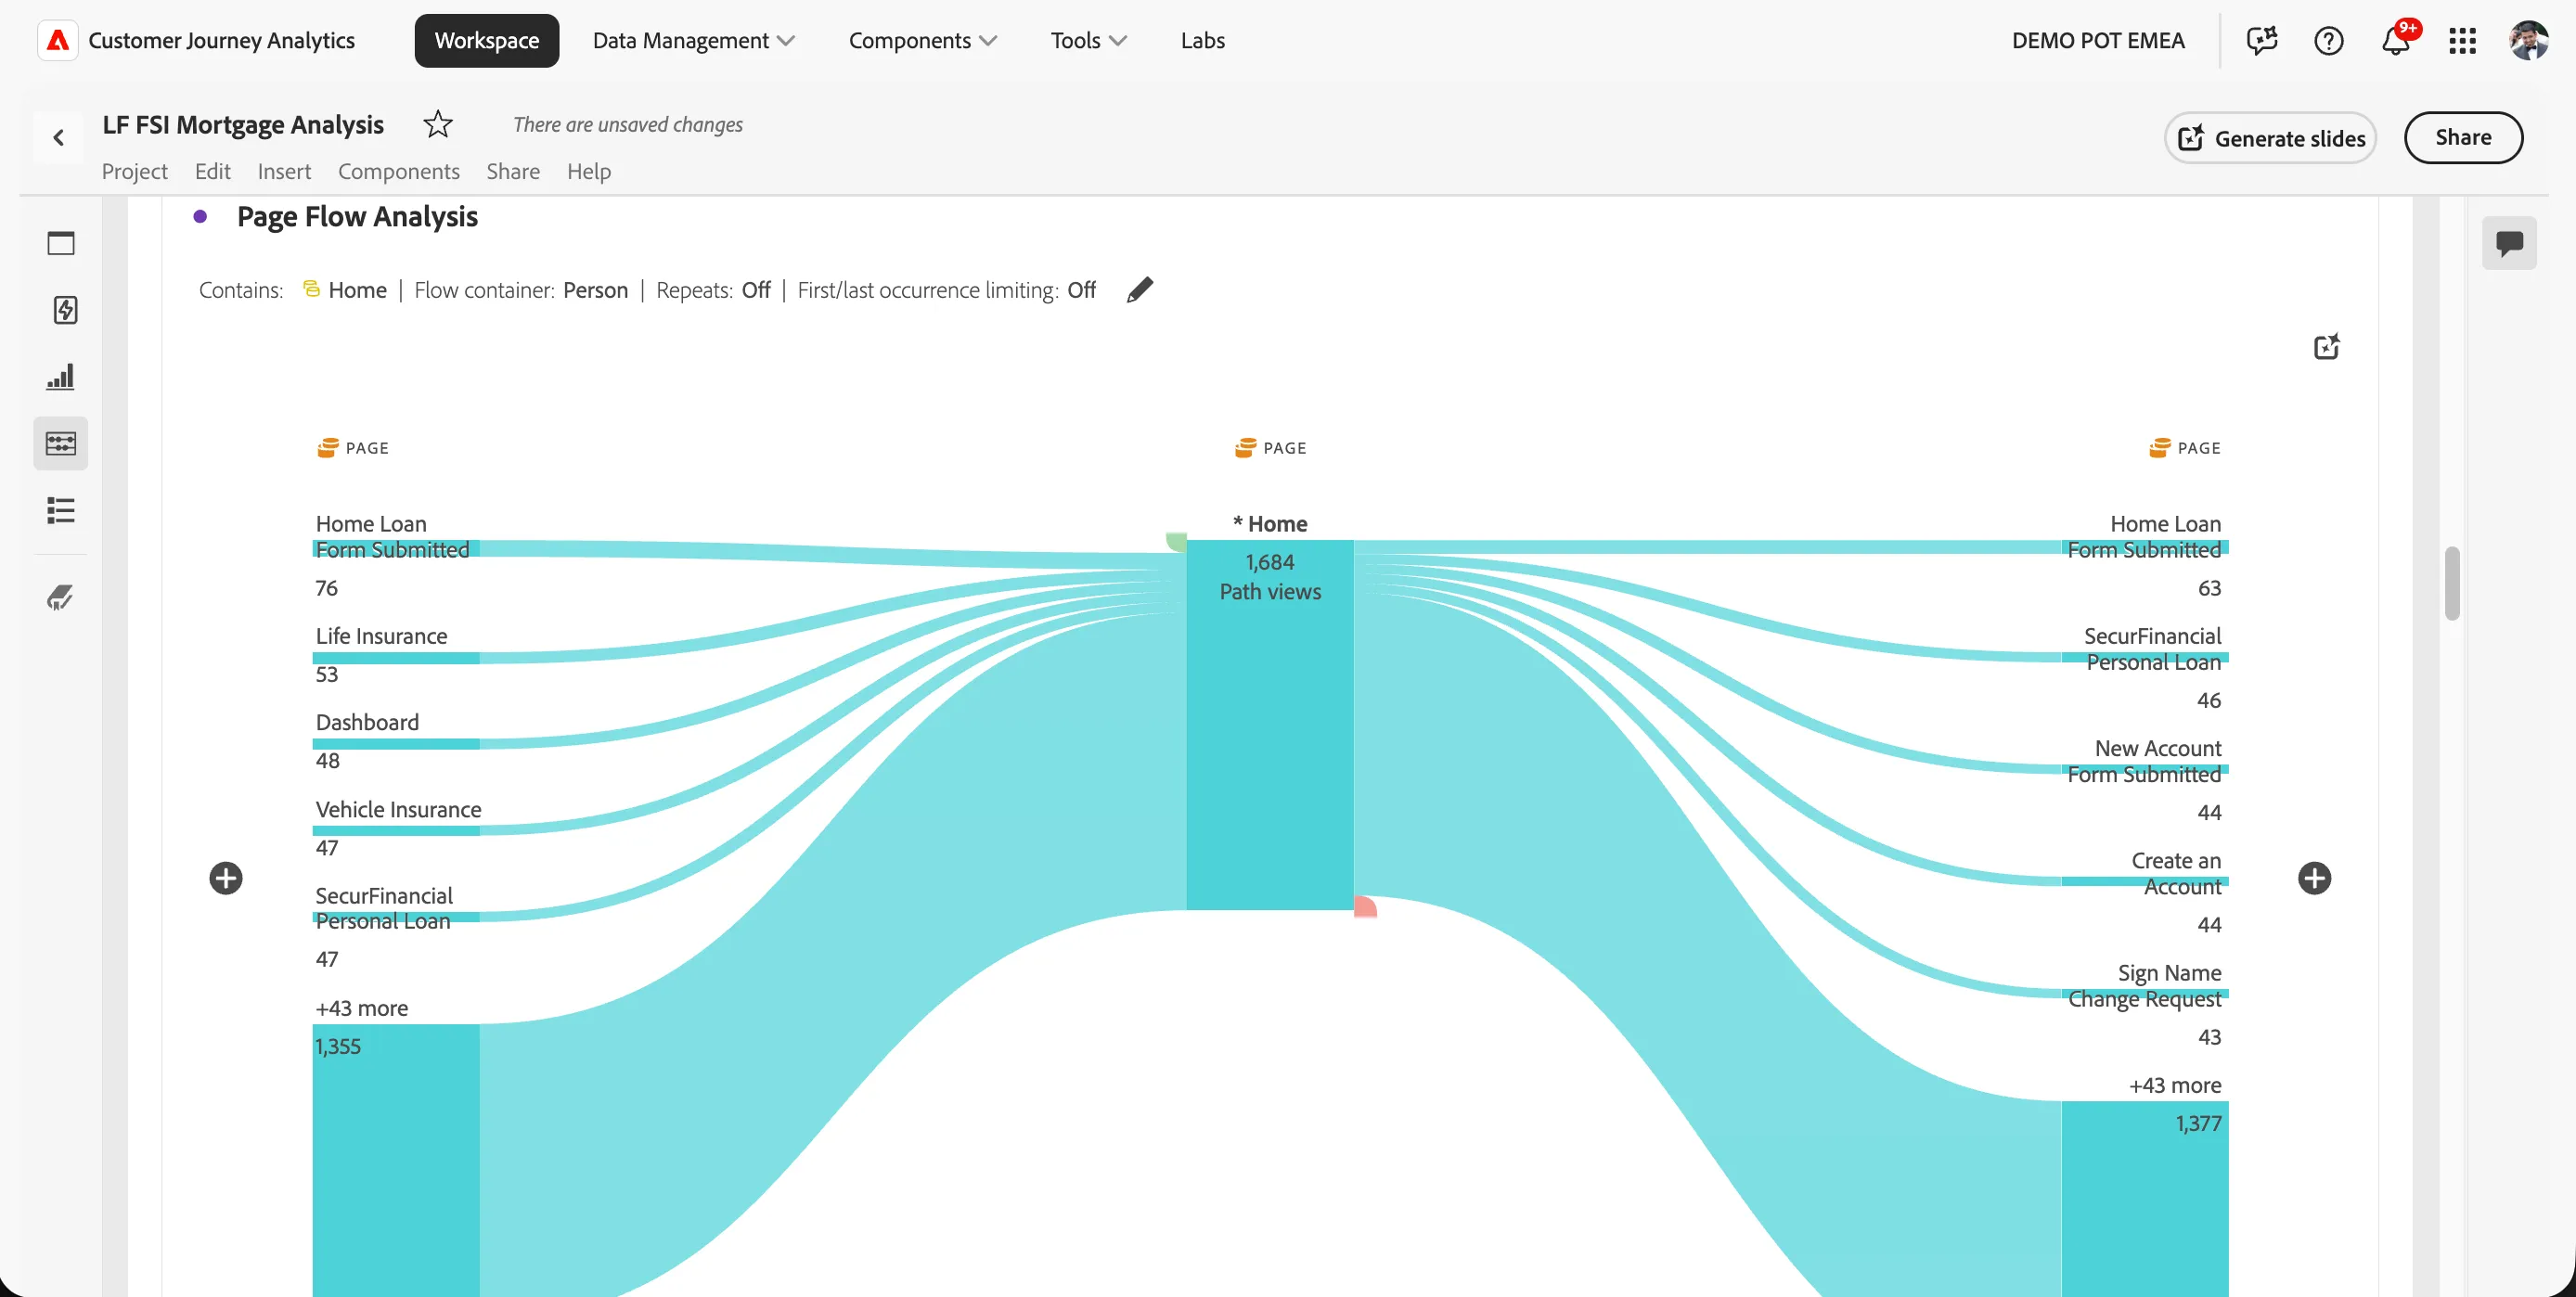
This diagram traces what customers do before and after submitting a Home Loan Form, visualized as a flow rather than a table. From the entry point, the largest paths lead through Home, then branch out into Life Insurance, Dashboard, Vehicle Insurance, and several personal loan and account-related pages.
Why this matters: this is the kind of view that helps LF spot cross-sell opportunities, customers submitting a mortgage form are also touching insurance and loan products in the same session, which is a real signal for the personalization and journey-orchestration story from earlier today.
Which pages drive customers to the Mortgage Calculator?
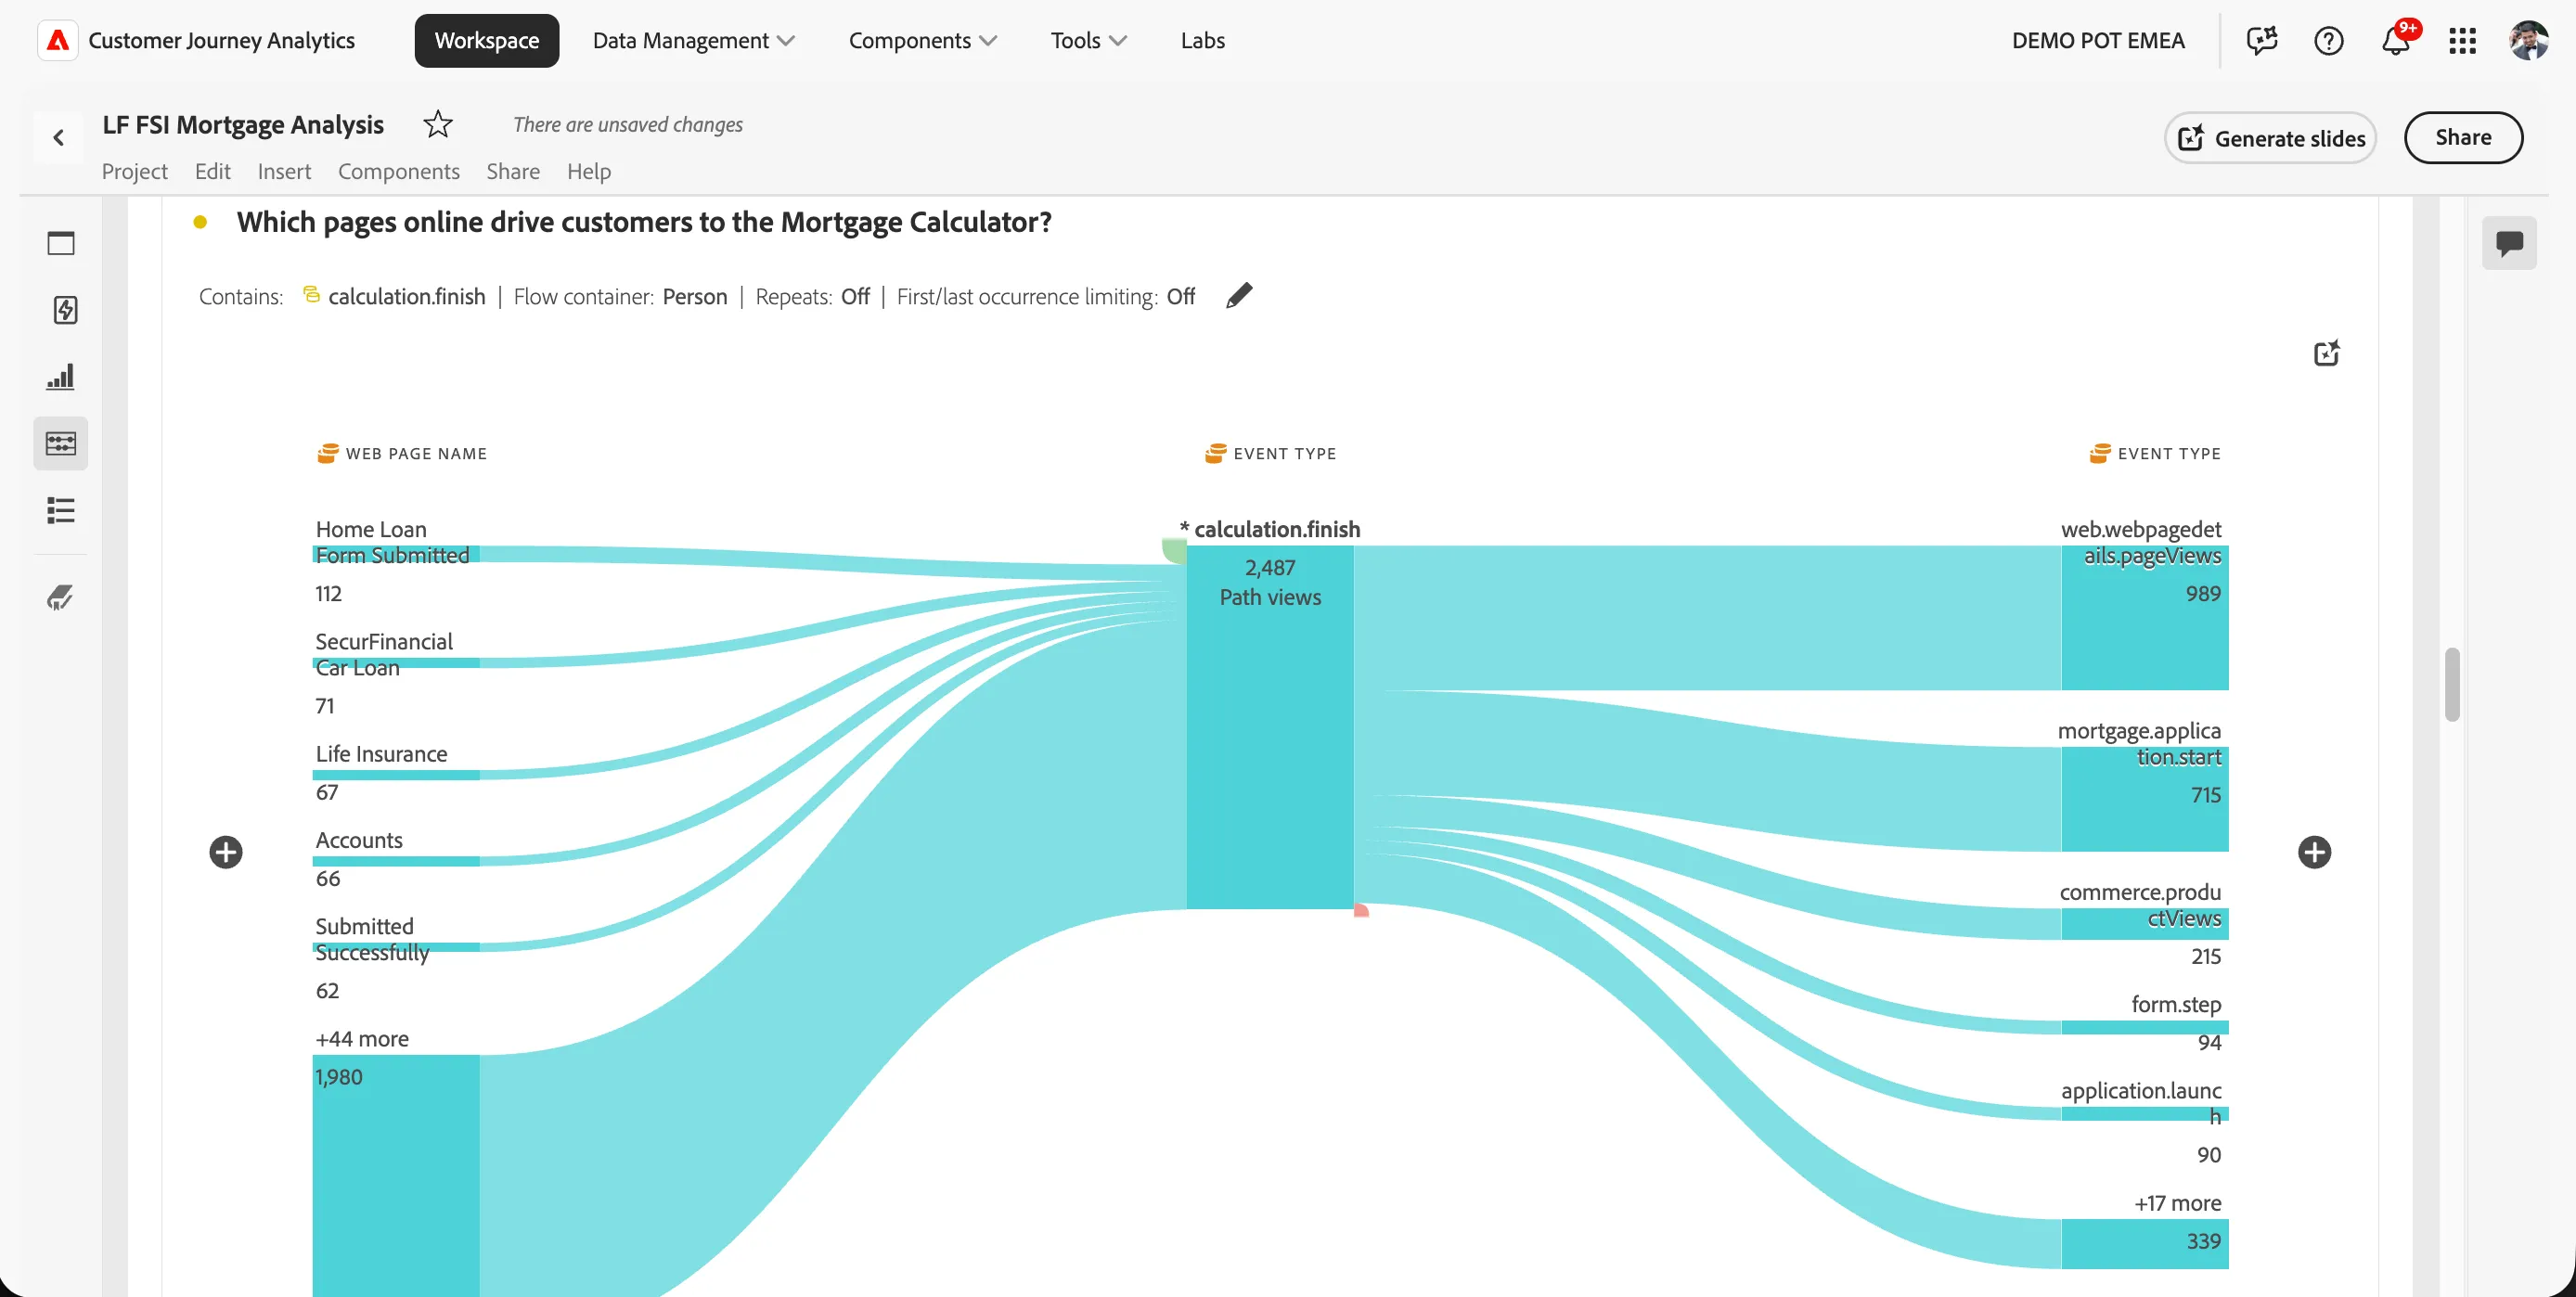
A second flow diagram, this time working backward from the calculation.finish event to see what led there. The largest contributing paths are page views, mortgage application starts, and product views, meaning most people who use the calculator arrive there directly through browsing rather than a long, indirect path. That's a good sign for the calculator's placement and discoverability.
Fallout Analysis
Mortgage Application Process (funnel)
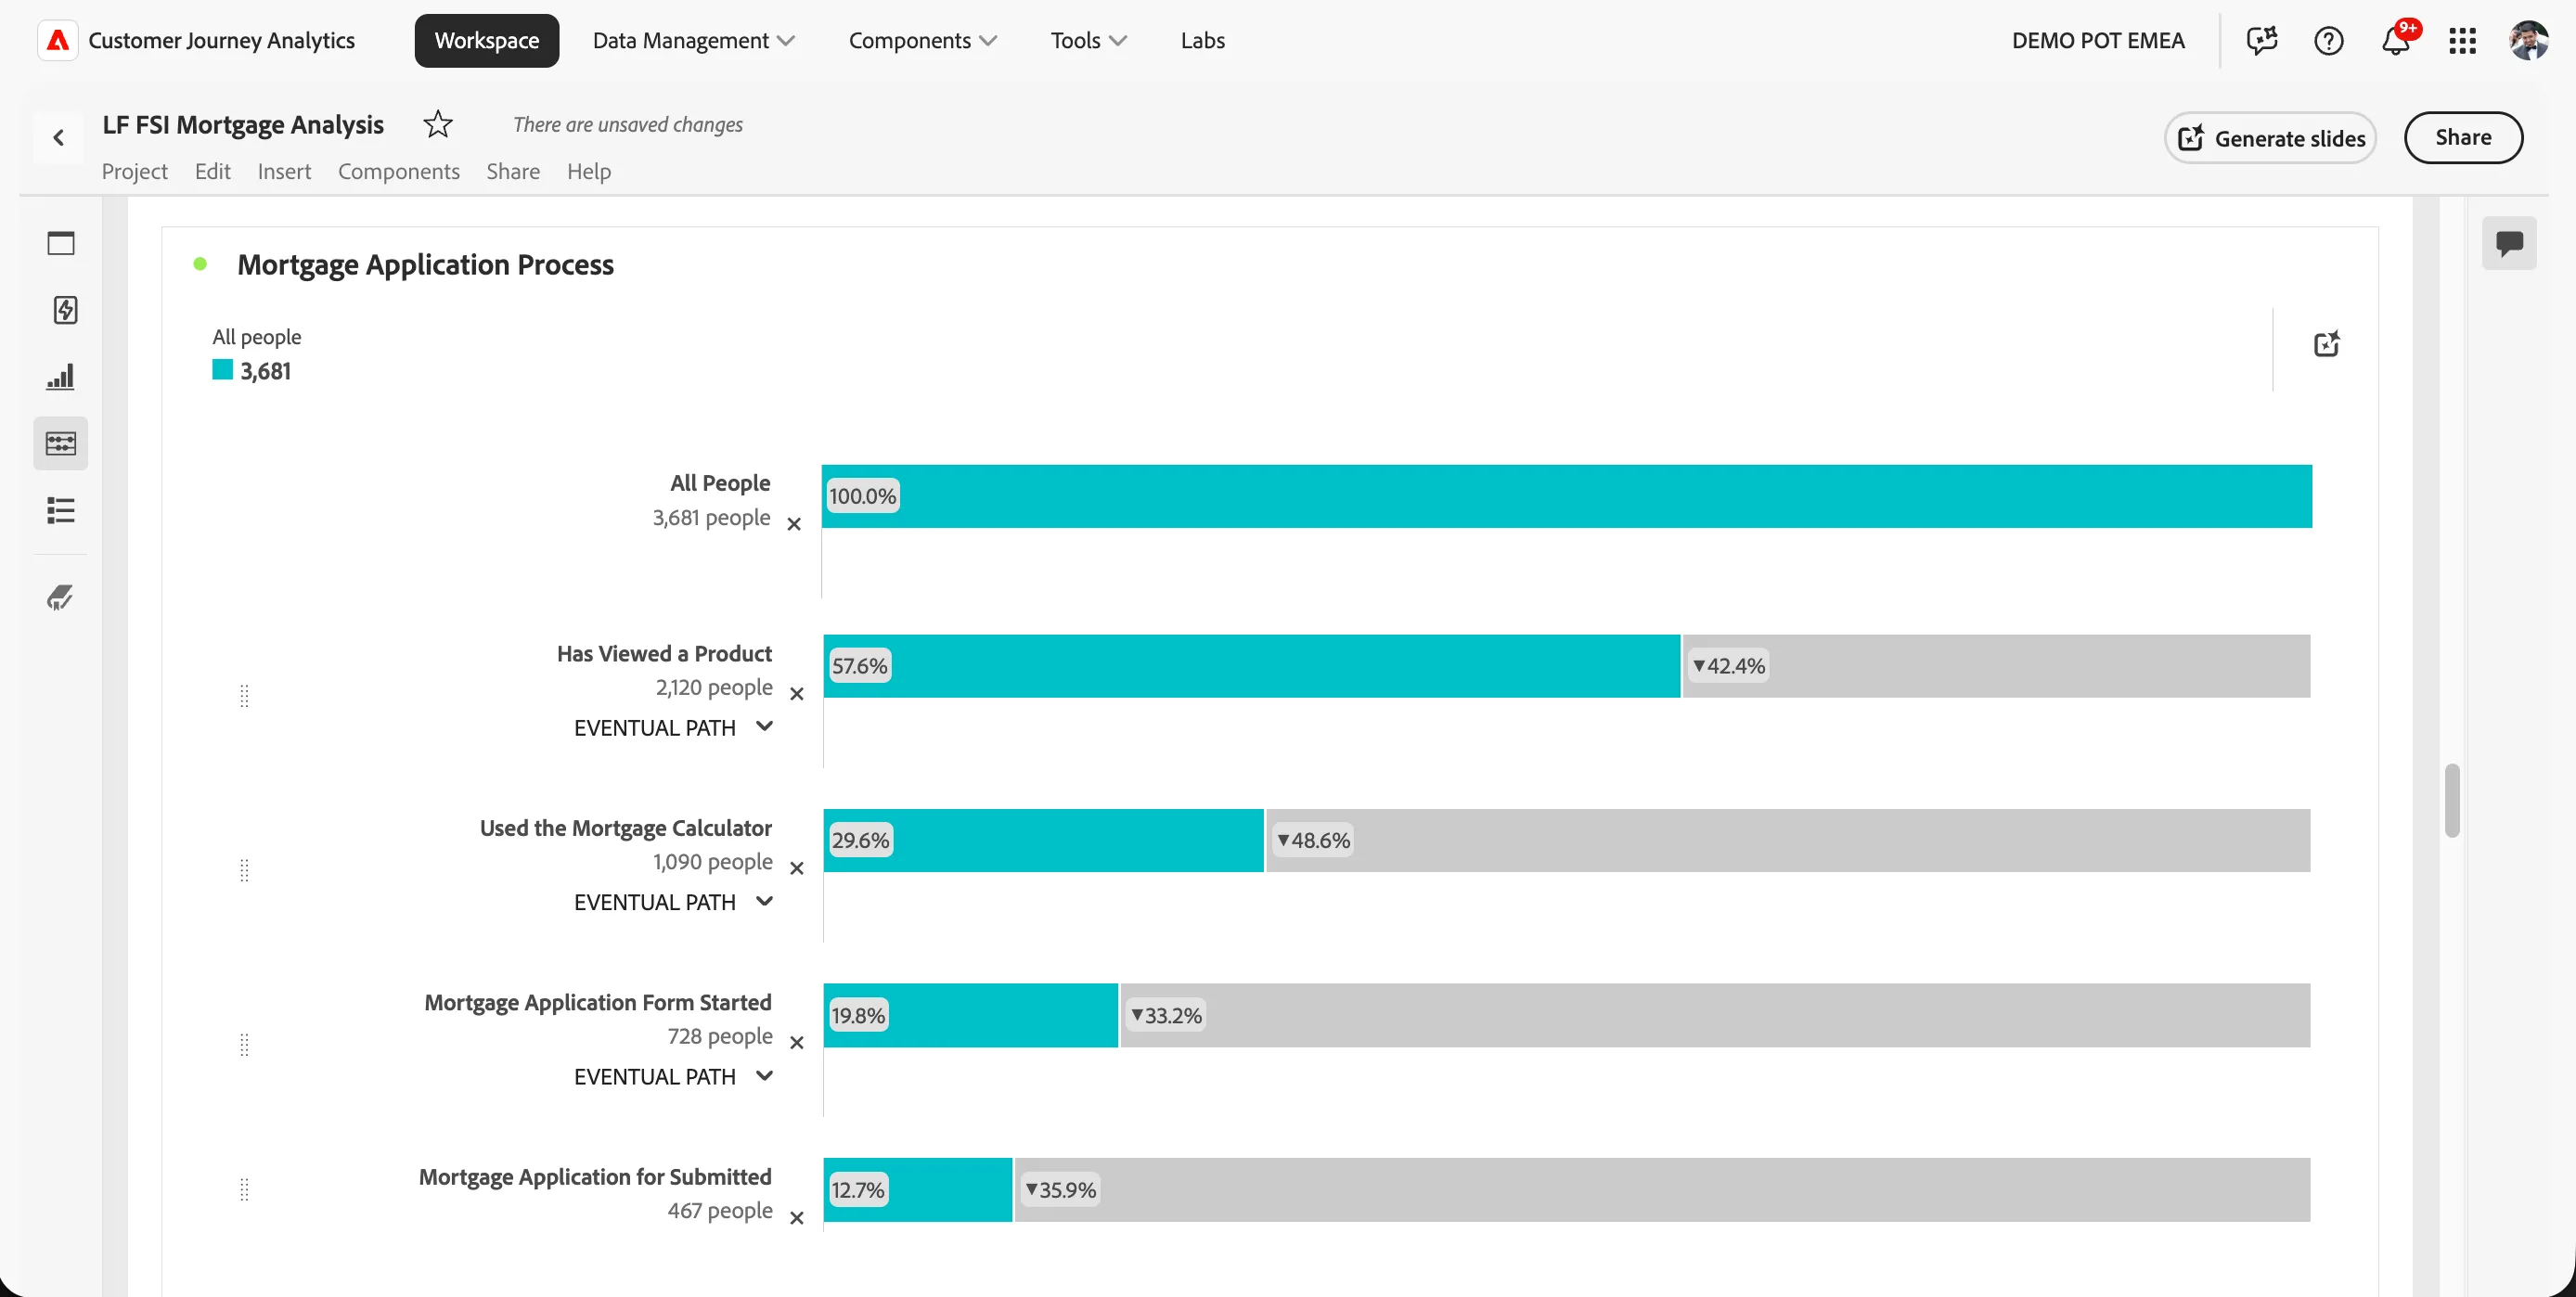
This is the core conversion funnel for the entire mortgage journey:
- 3,681 total people
- → 2,120 viewed a product (57.6%)
- → 1,090 used the mortgage calculator (29.6% of total)
- → 728 started the application form (19.8% of total)
- → 467 submitted the application (12.7% of total)
Each step shows a meaningful drop-off, roughly half the funnel is lost between "viewed a product" and "used the calculator," and again between "used the calculator" and "started the form."
Why this matters for LF: this funnel is the single clearest place to point to when discussing where the mortgage journey loses people, and it directly validates why a fast, well-designed calculator experience (like the one built into today's page) matters commercially, not just as a nice-to-have feature.
Of those who abandoned on the last step, what did they do instead?
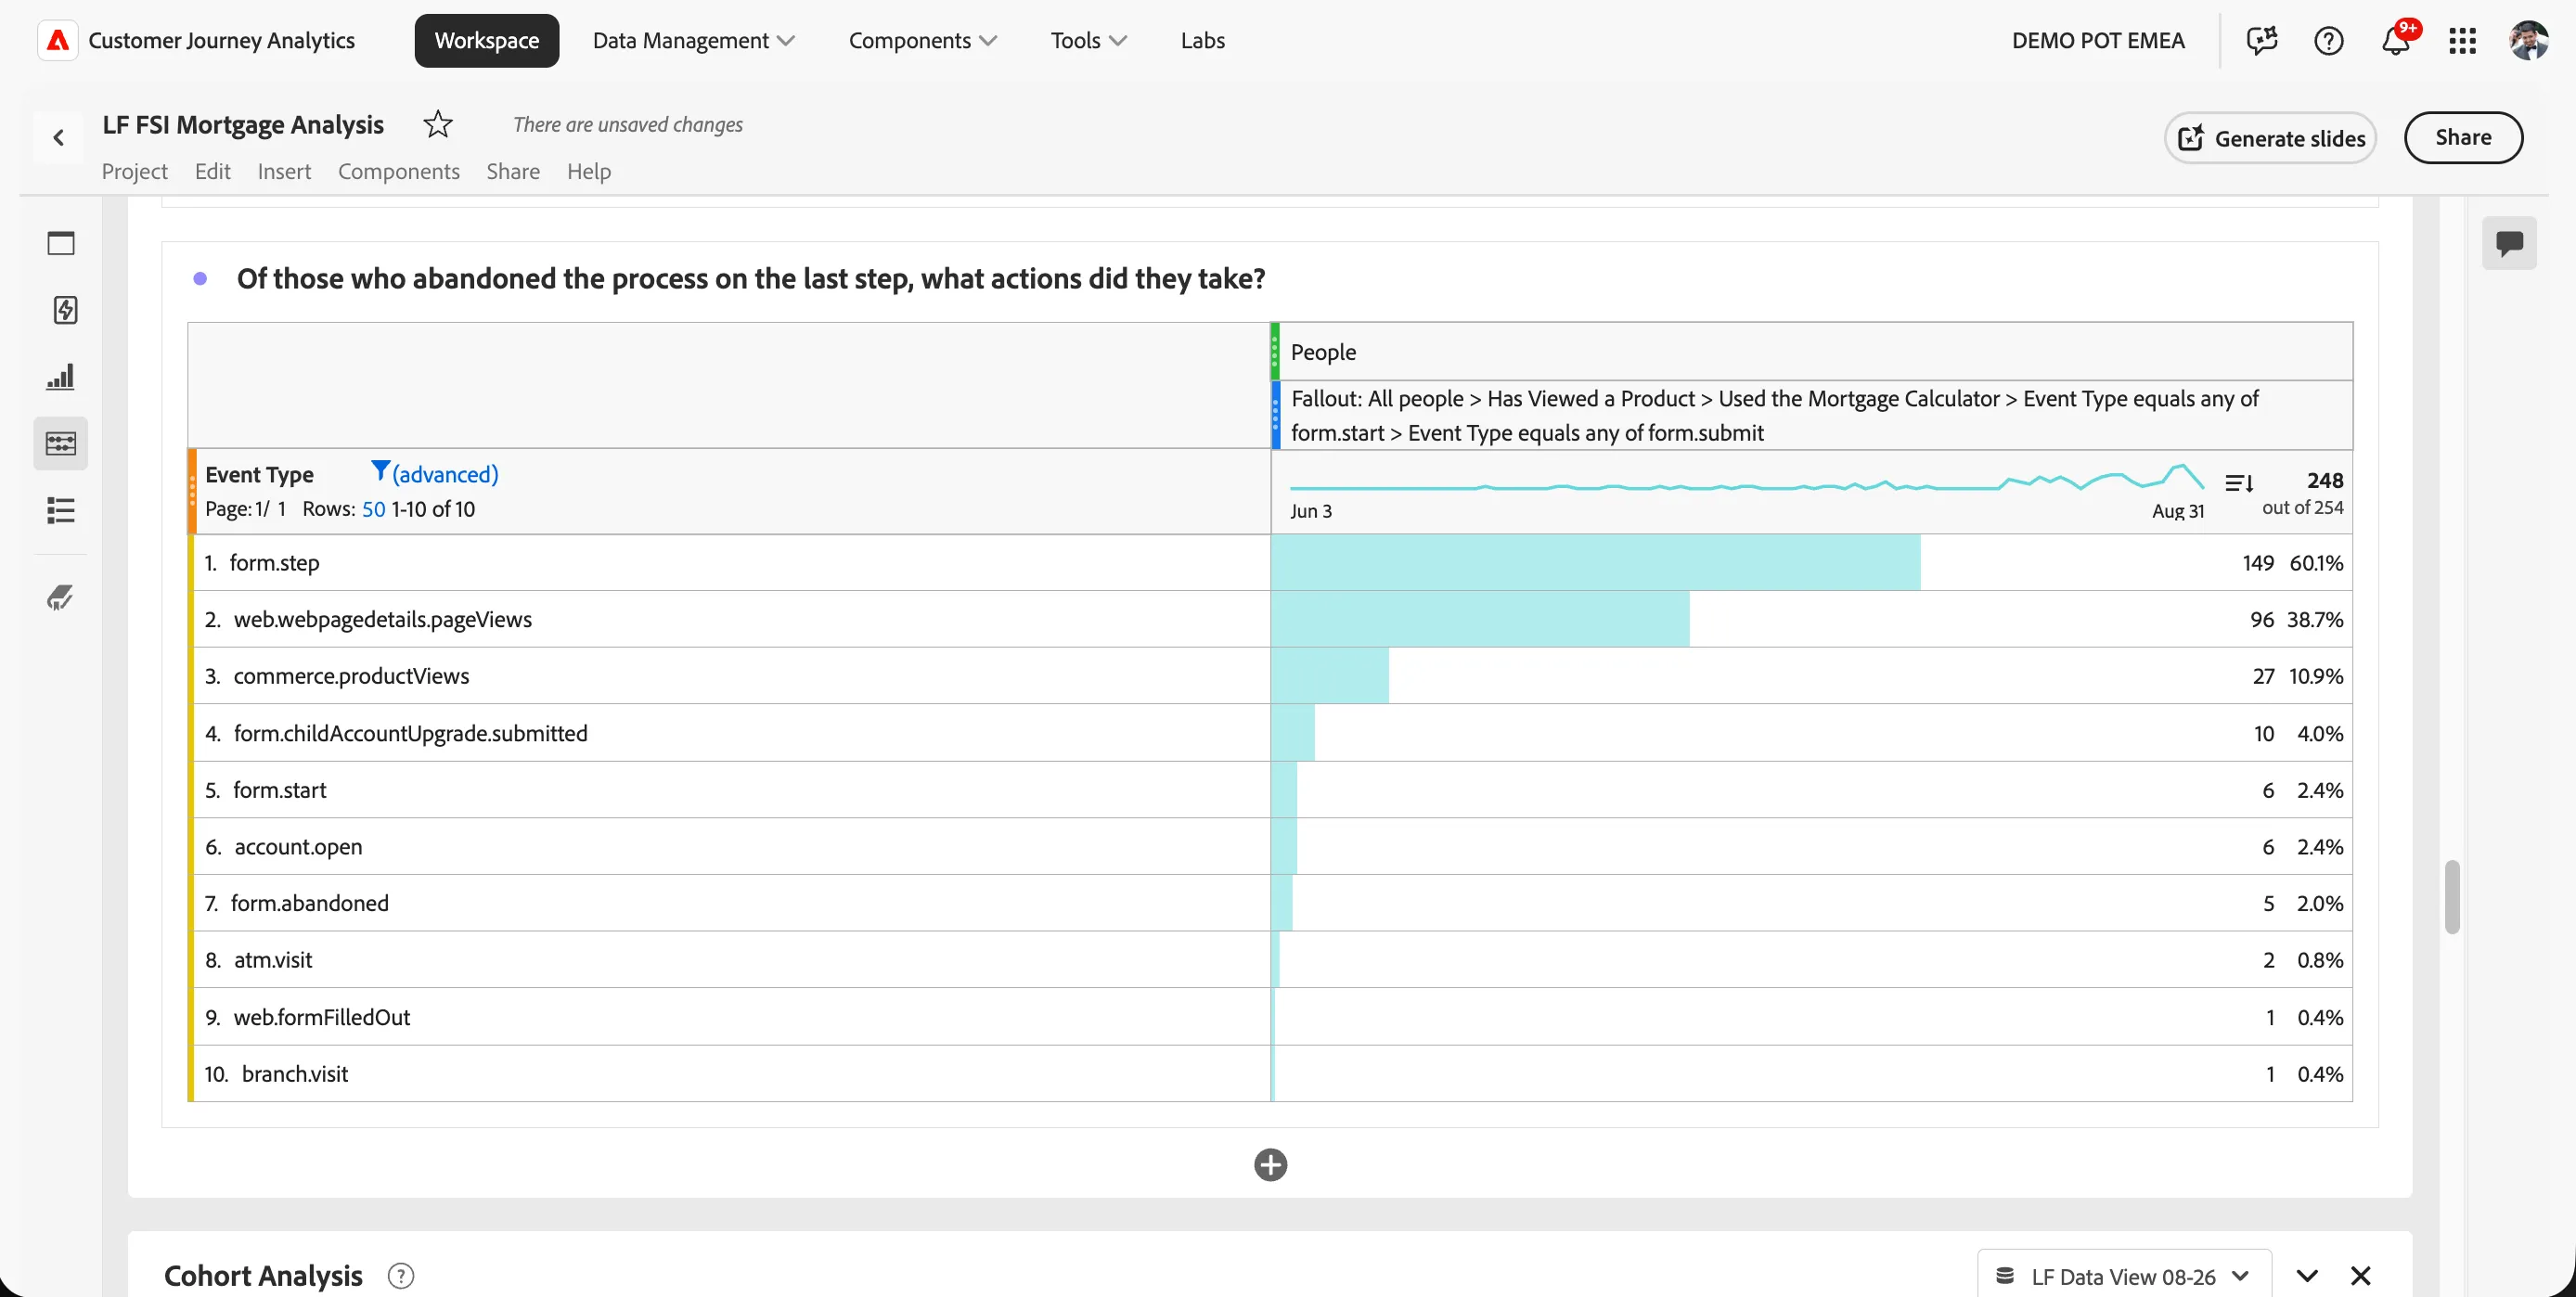
For the 248 people who didn't complete the final submission after starting, the most common next actions were continuing to fill out other form steps (60.1%) or continuing to browse pages (38.7%), rather than leaving the site outright. That's a meaningfully different message than "they gave up", most stayed engaged, just not on this particular form.
Cohort Analysis
Time between Online Visit and Mortgage Application (retention table)
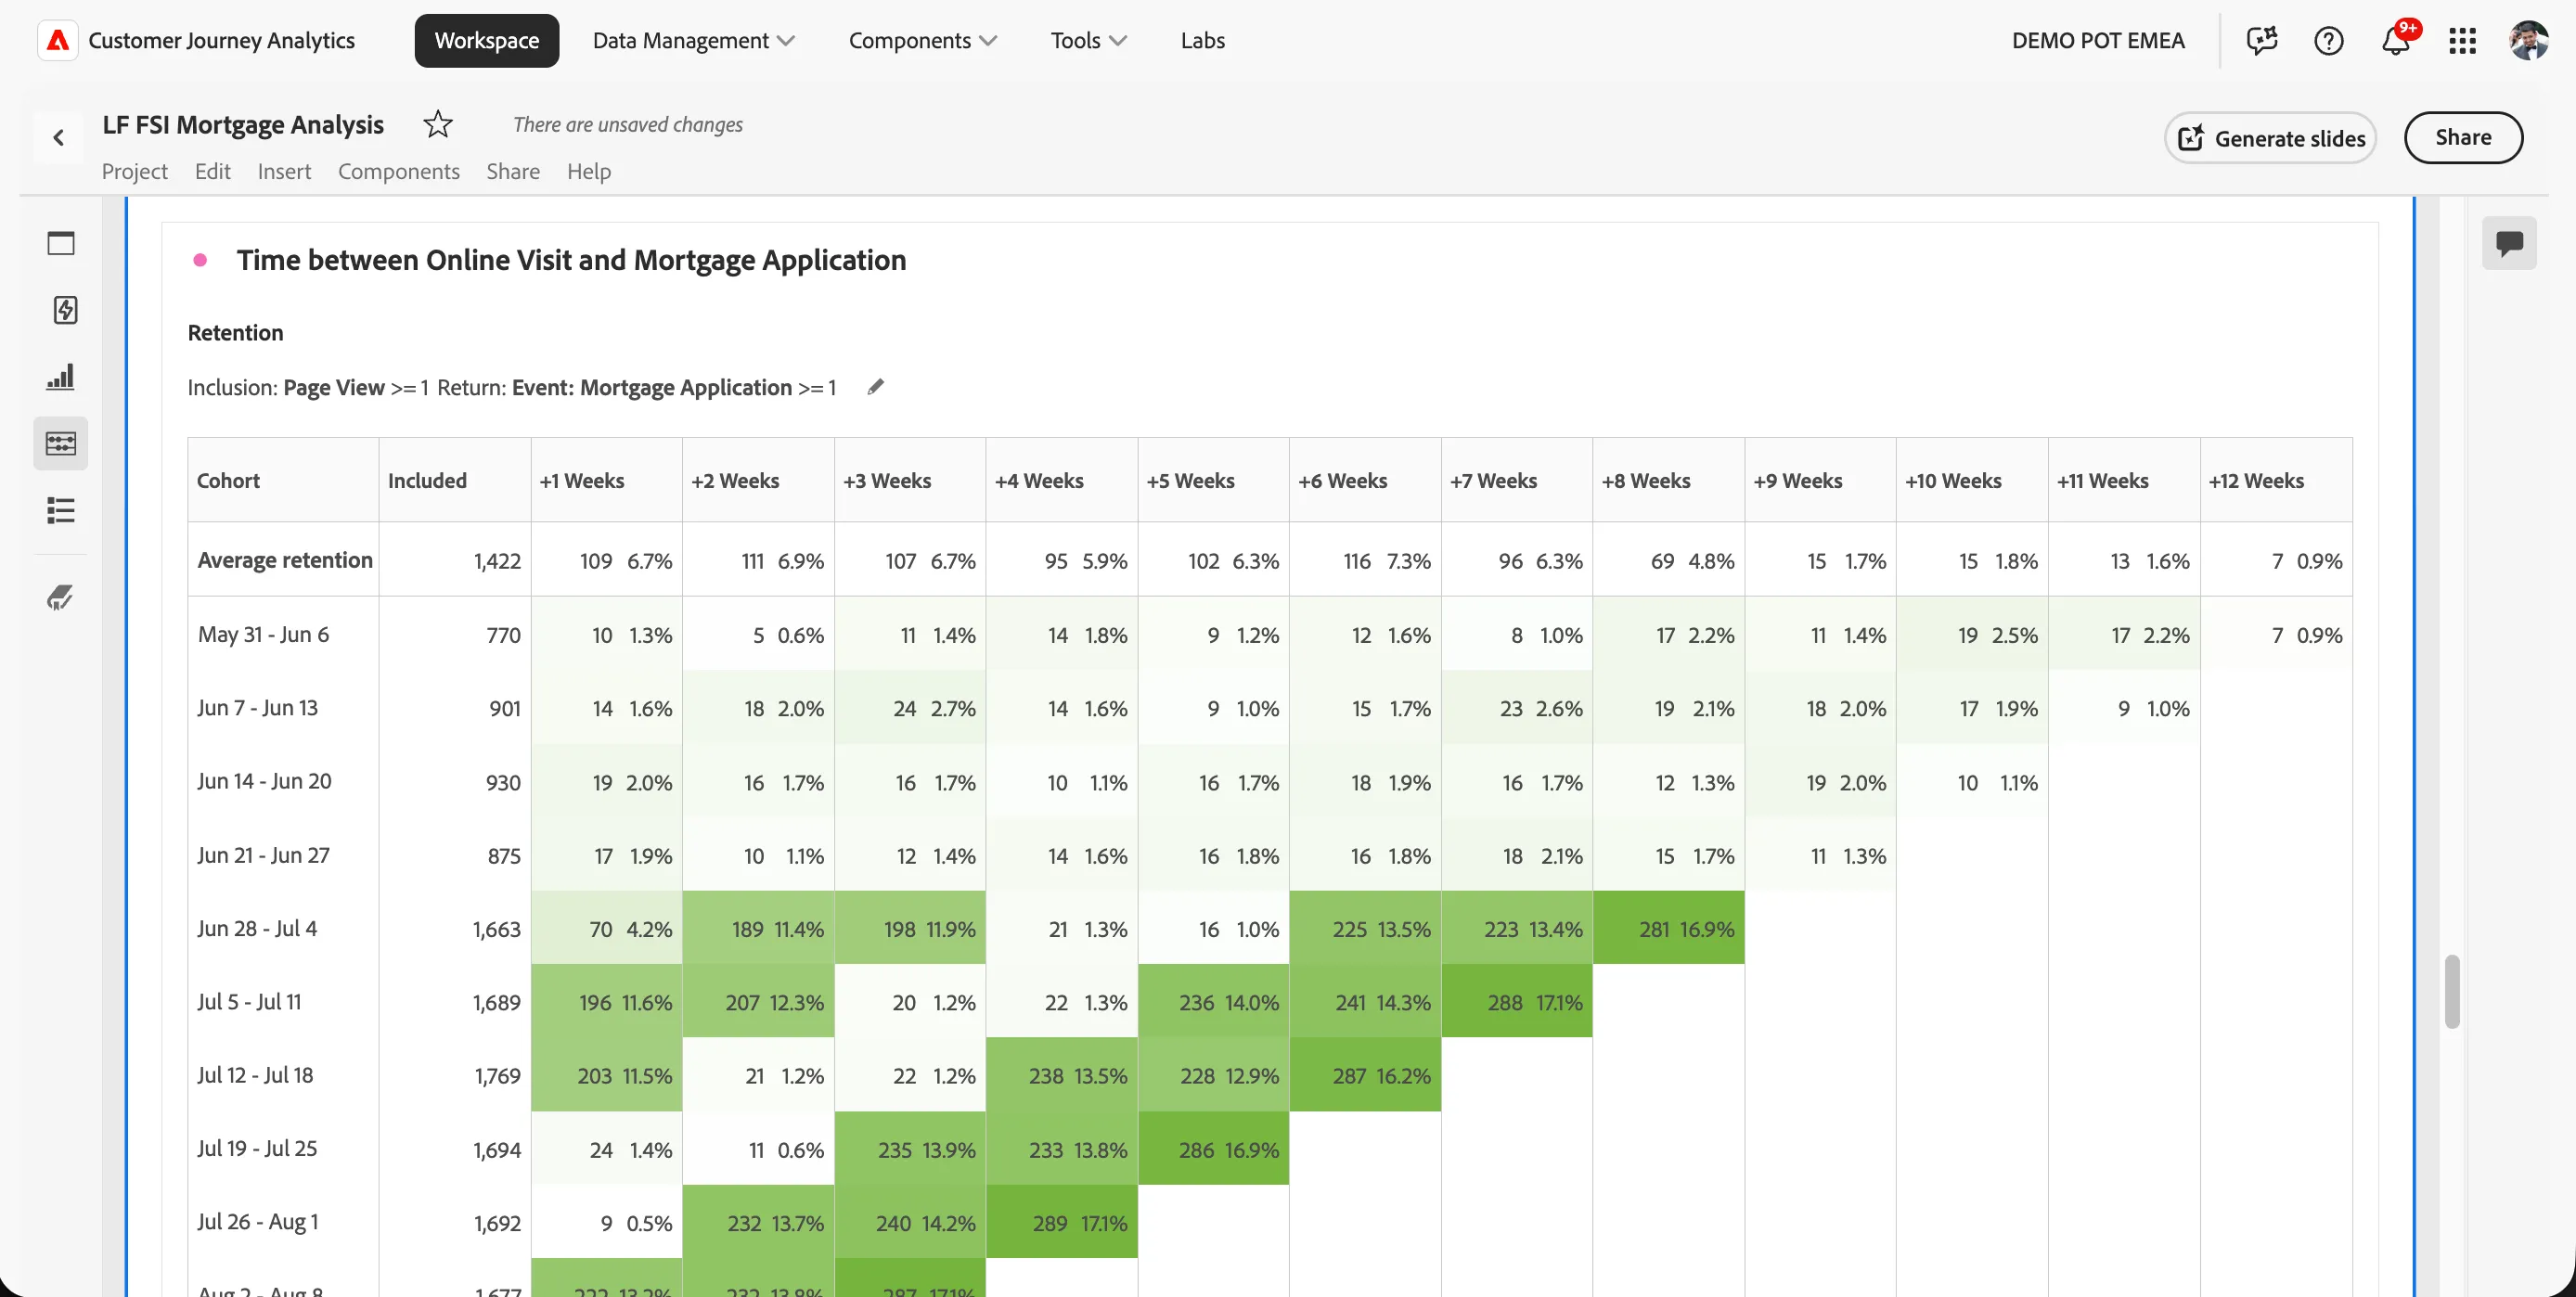
This table groups visitors by the week they first visited, then tracks what percentage of each weekly cohort went on to submit a mortgage application in each following week. Early cohorts show modest, fairly flat return rates (1–3%), while more recent cohorts (late June through August) show a stronger pattern, climbing into the mid-to-high teens by week 7–8.
Why this matters for LF: this view answers a question a simple conversion rate can't, how long does it typically take someone to go from browsing to applying? That's directly useful for deciding how long to keep nurturing a visitor with content or reminders before assuming they've moved on.
Experimentation
This is the same A/B test capability shown live earlier today, using the Experimentation extension in Universal Editor. This panel shows what real results from that kind of test look like once data has accumulated.
Variants by Proposition Interact
- Variant 0 (control): 705 people, 222 interacted (52.4%), conversion rate 0.31
- Variant 1 (challenger): 706 people, 202 interacted (47.6%), conversion rate 0.29, a -9.1% lift, at 45.1% confidence
Variants by Event: Calculation Finished
- Variant 1: 706 people, 67 finished (51.1%), conversion rate 0.09
- Variant 0: 705 people, 64 finished (48.9%), conversion rate 0.09, effectively 0% lift, 0% confidence
This is a genuinely useful moment to make with LF: the platform doesn't just report wins, it gives an honest, statistically grounded read on whether a change actually moved the needle. A flat or negative result, reported clearly, is exactly what a mature experimentation practice looks like, it just as easily could have shown the opposite.
What You Learned
You've now seen how:
- ✅ Channel and traffic data can be monitored in real time, across web, mobile, and assisted channels
- ✅ Page and content performance can be analyzed by audience, channel, and journey stage
- ✅ Funnel and fallout analysis reveal exactly where customers drop off, and what they do instead
- ✅ Cohort analysis shows how long it takes customers to move from browsing to applying
- ✅ A/B test results from the Experimentation step feed into the same reporting layer, with honest statistical confidence, not just a declared "winner"