Analyse purchase frequency
Reminder!
Data may have changed and Coworker can interpret requests differently sometimes, so don't panic if your results do not match exactly what you see in this guide. Take your time to read and understand the results.
Luma's marketing team suspects that how a customer receives their order — home delivery vs. in-store pickup — changes how often they come back to buy again. If one group buys less frequently, its experience is worth investing in, because fewer repeat purchases mean lost revenue.
Your task: use Coworker to compare purchase frequency between the two groups and confirm whether the gap is real.
Prompt sequence
Let's start by getting the lay of the land.
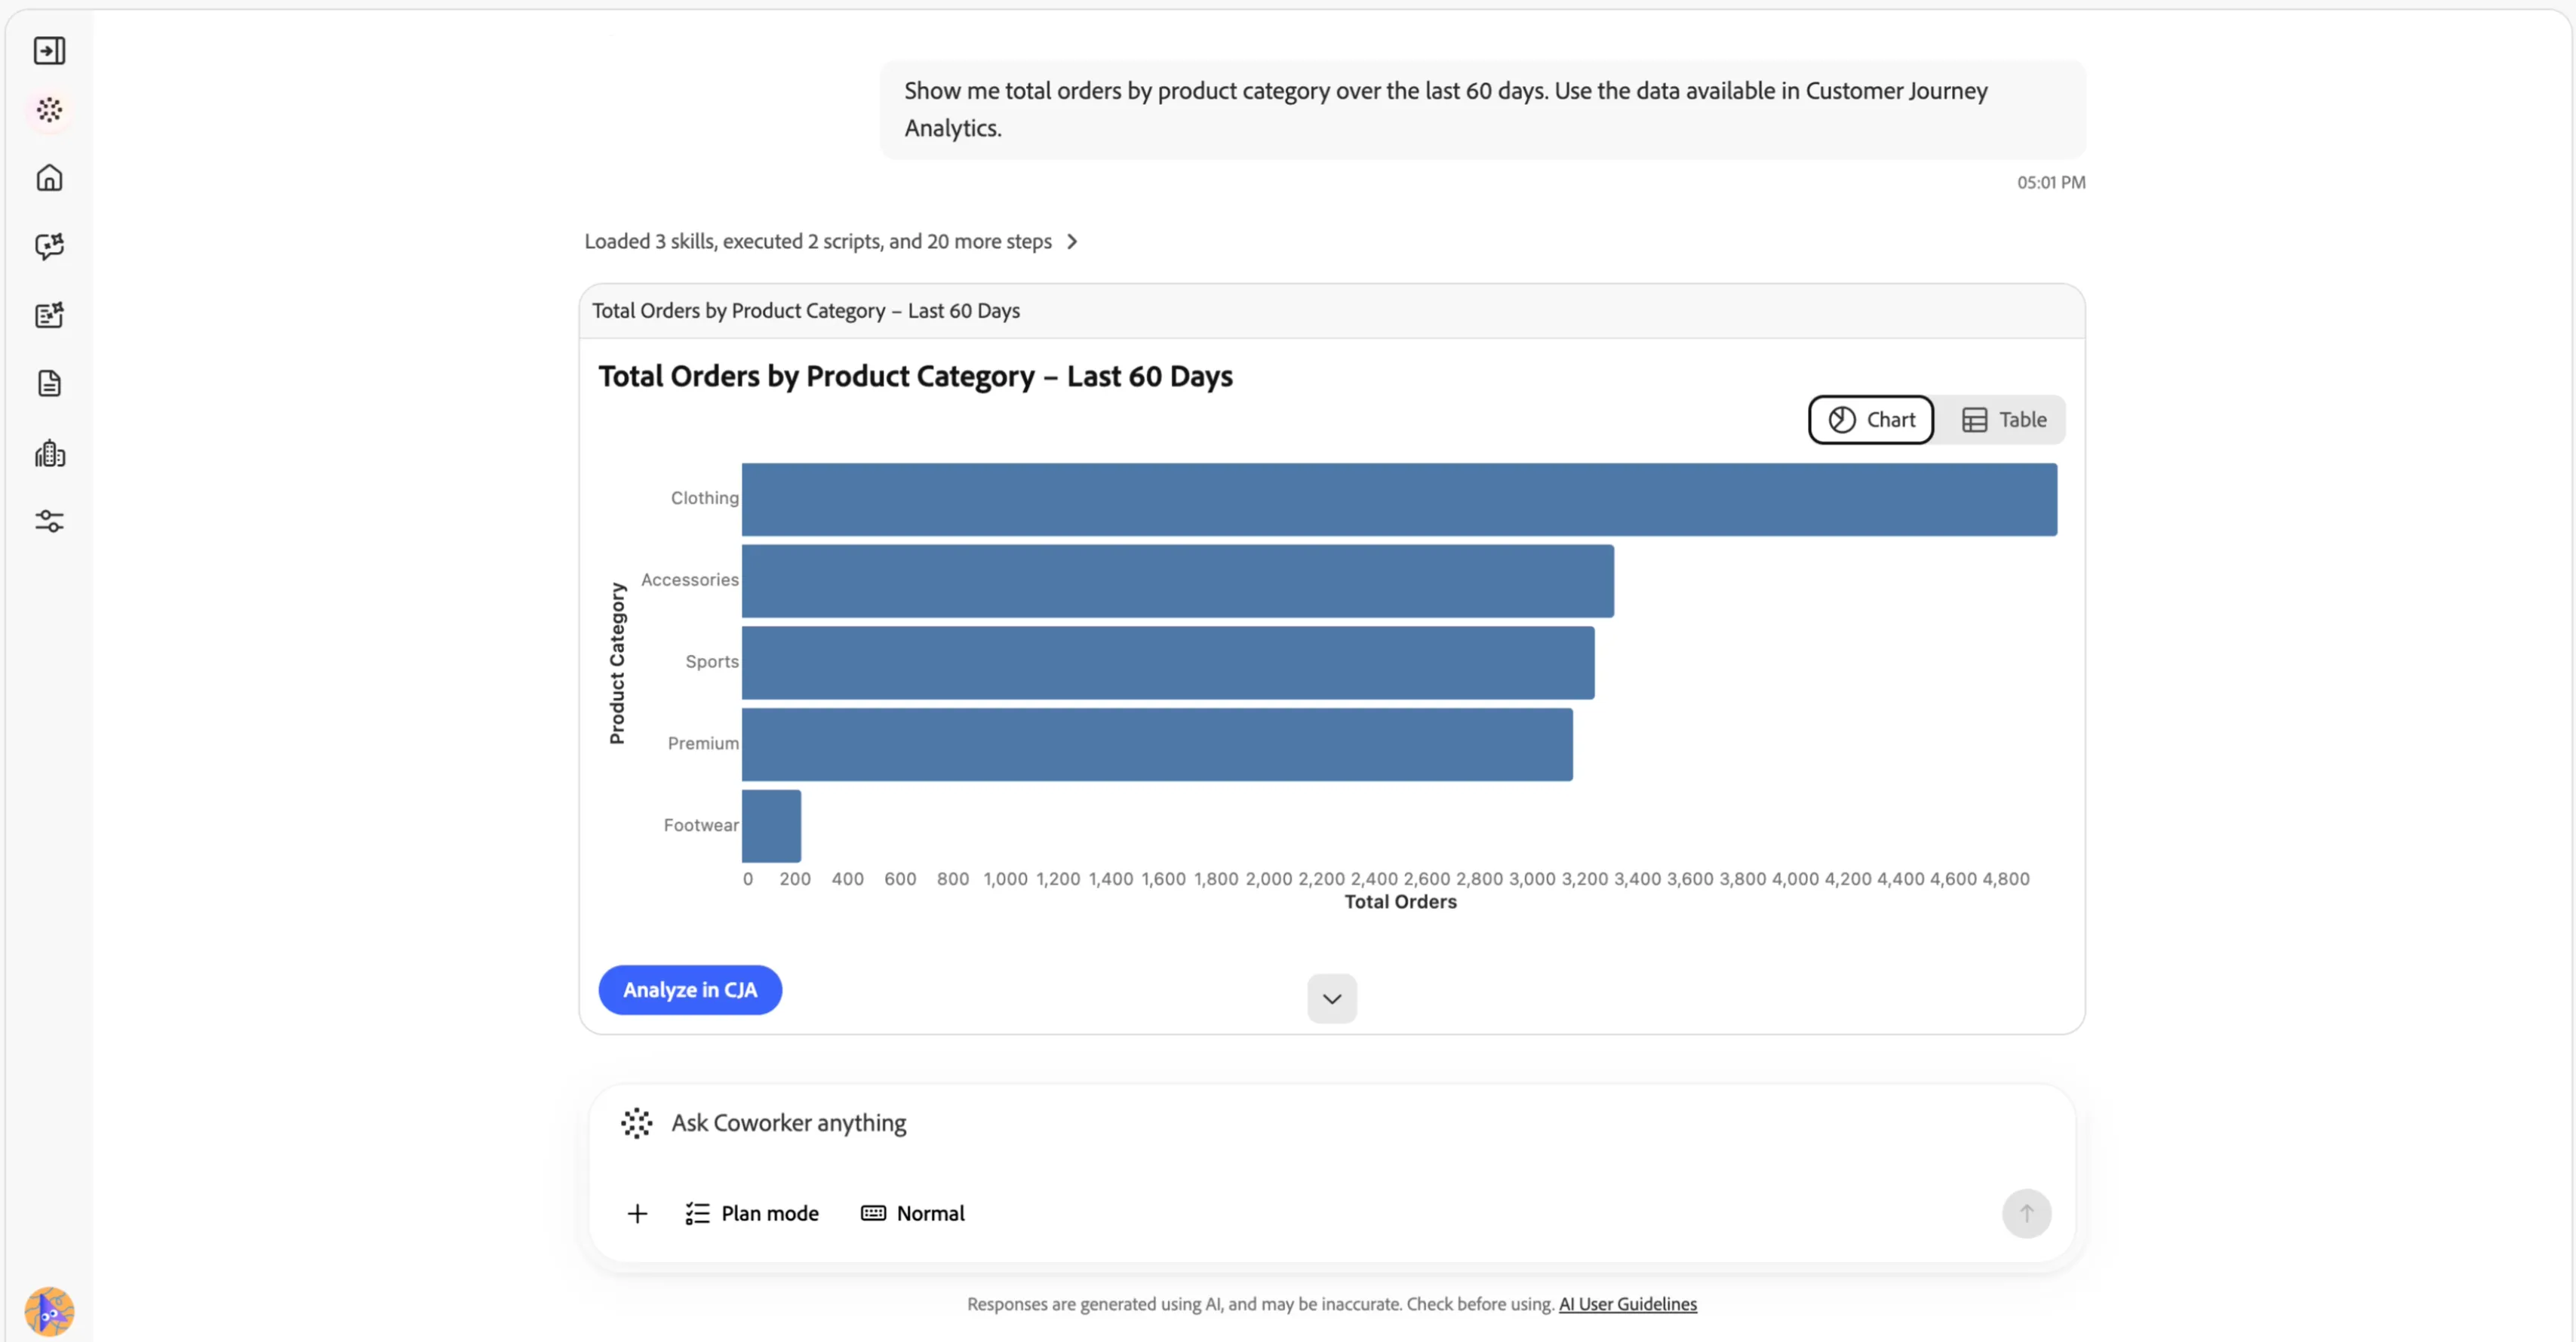
Expected outcome: a breakdown of purchase volume by product category, giving you a feel for what Luma customers are buying.
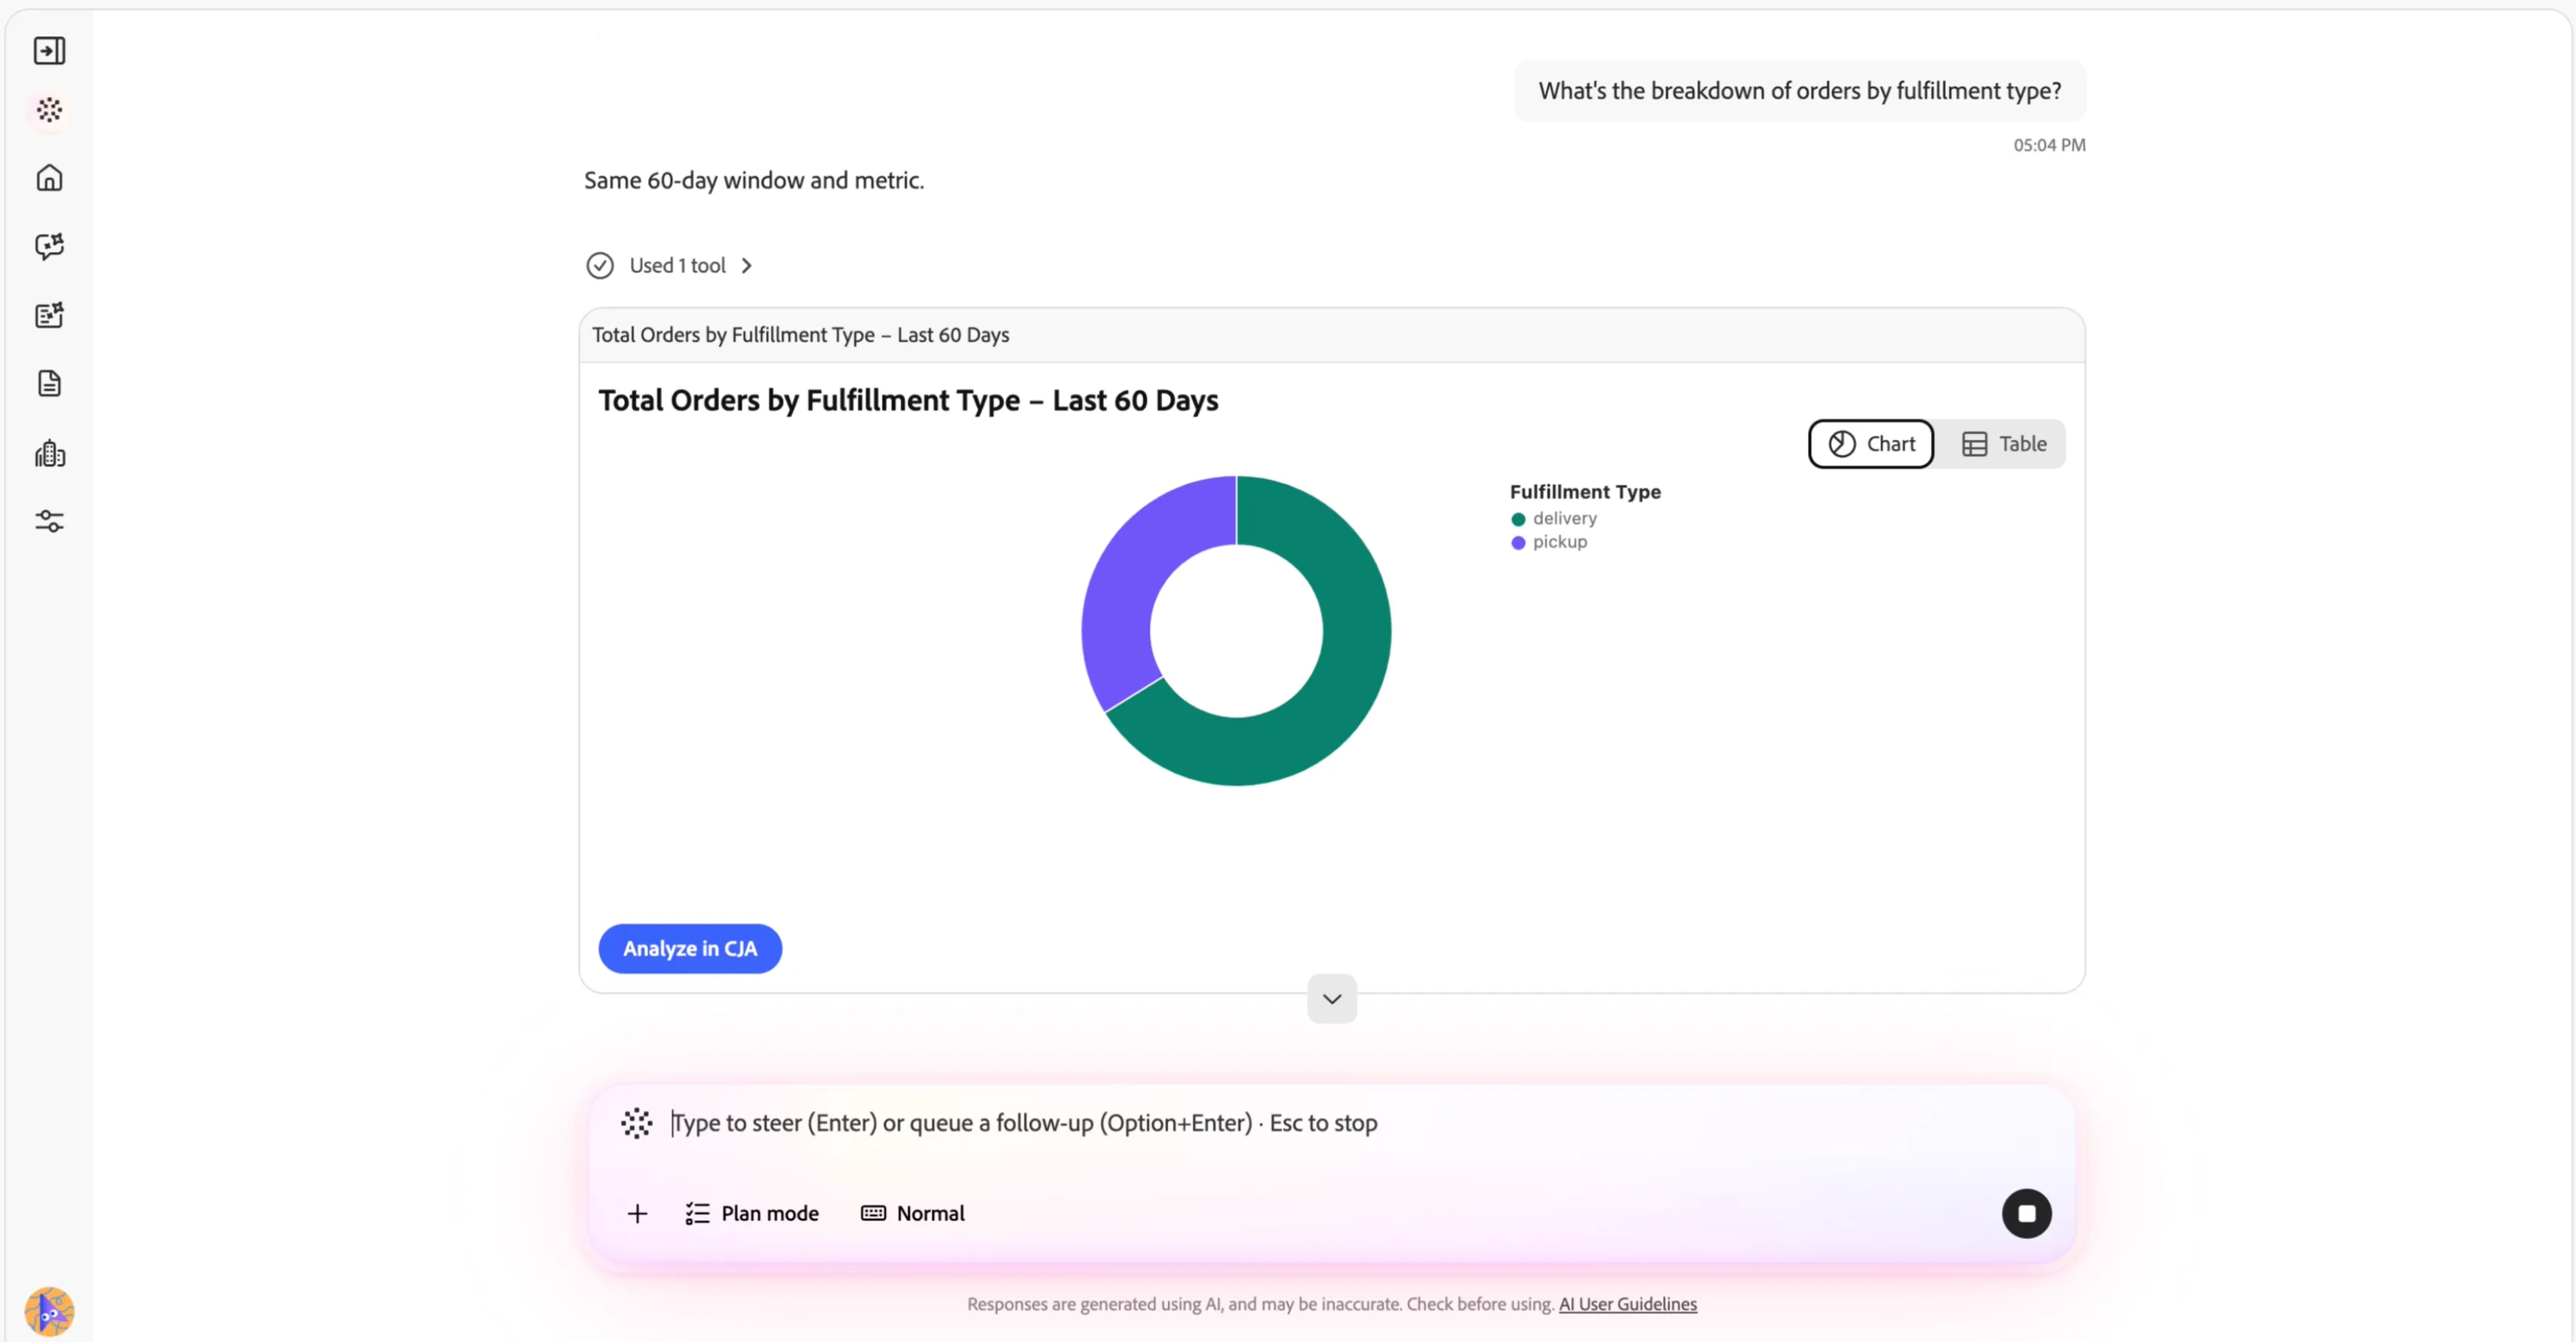
Now let's introduce the dimension that matters for this analysis: how orders are fulfilled.
Expected outcome: the split of orders between home delivery and in-store pickup.
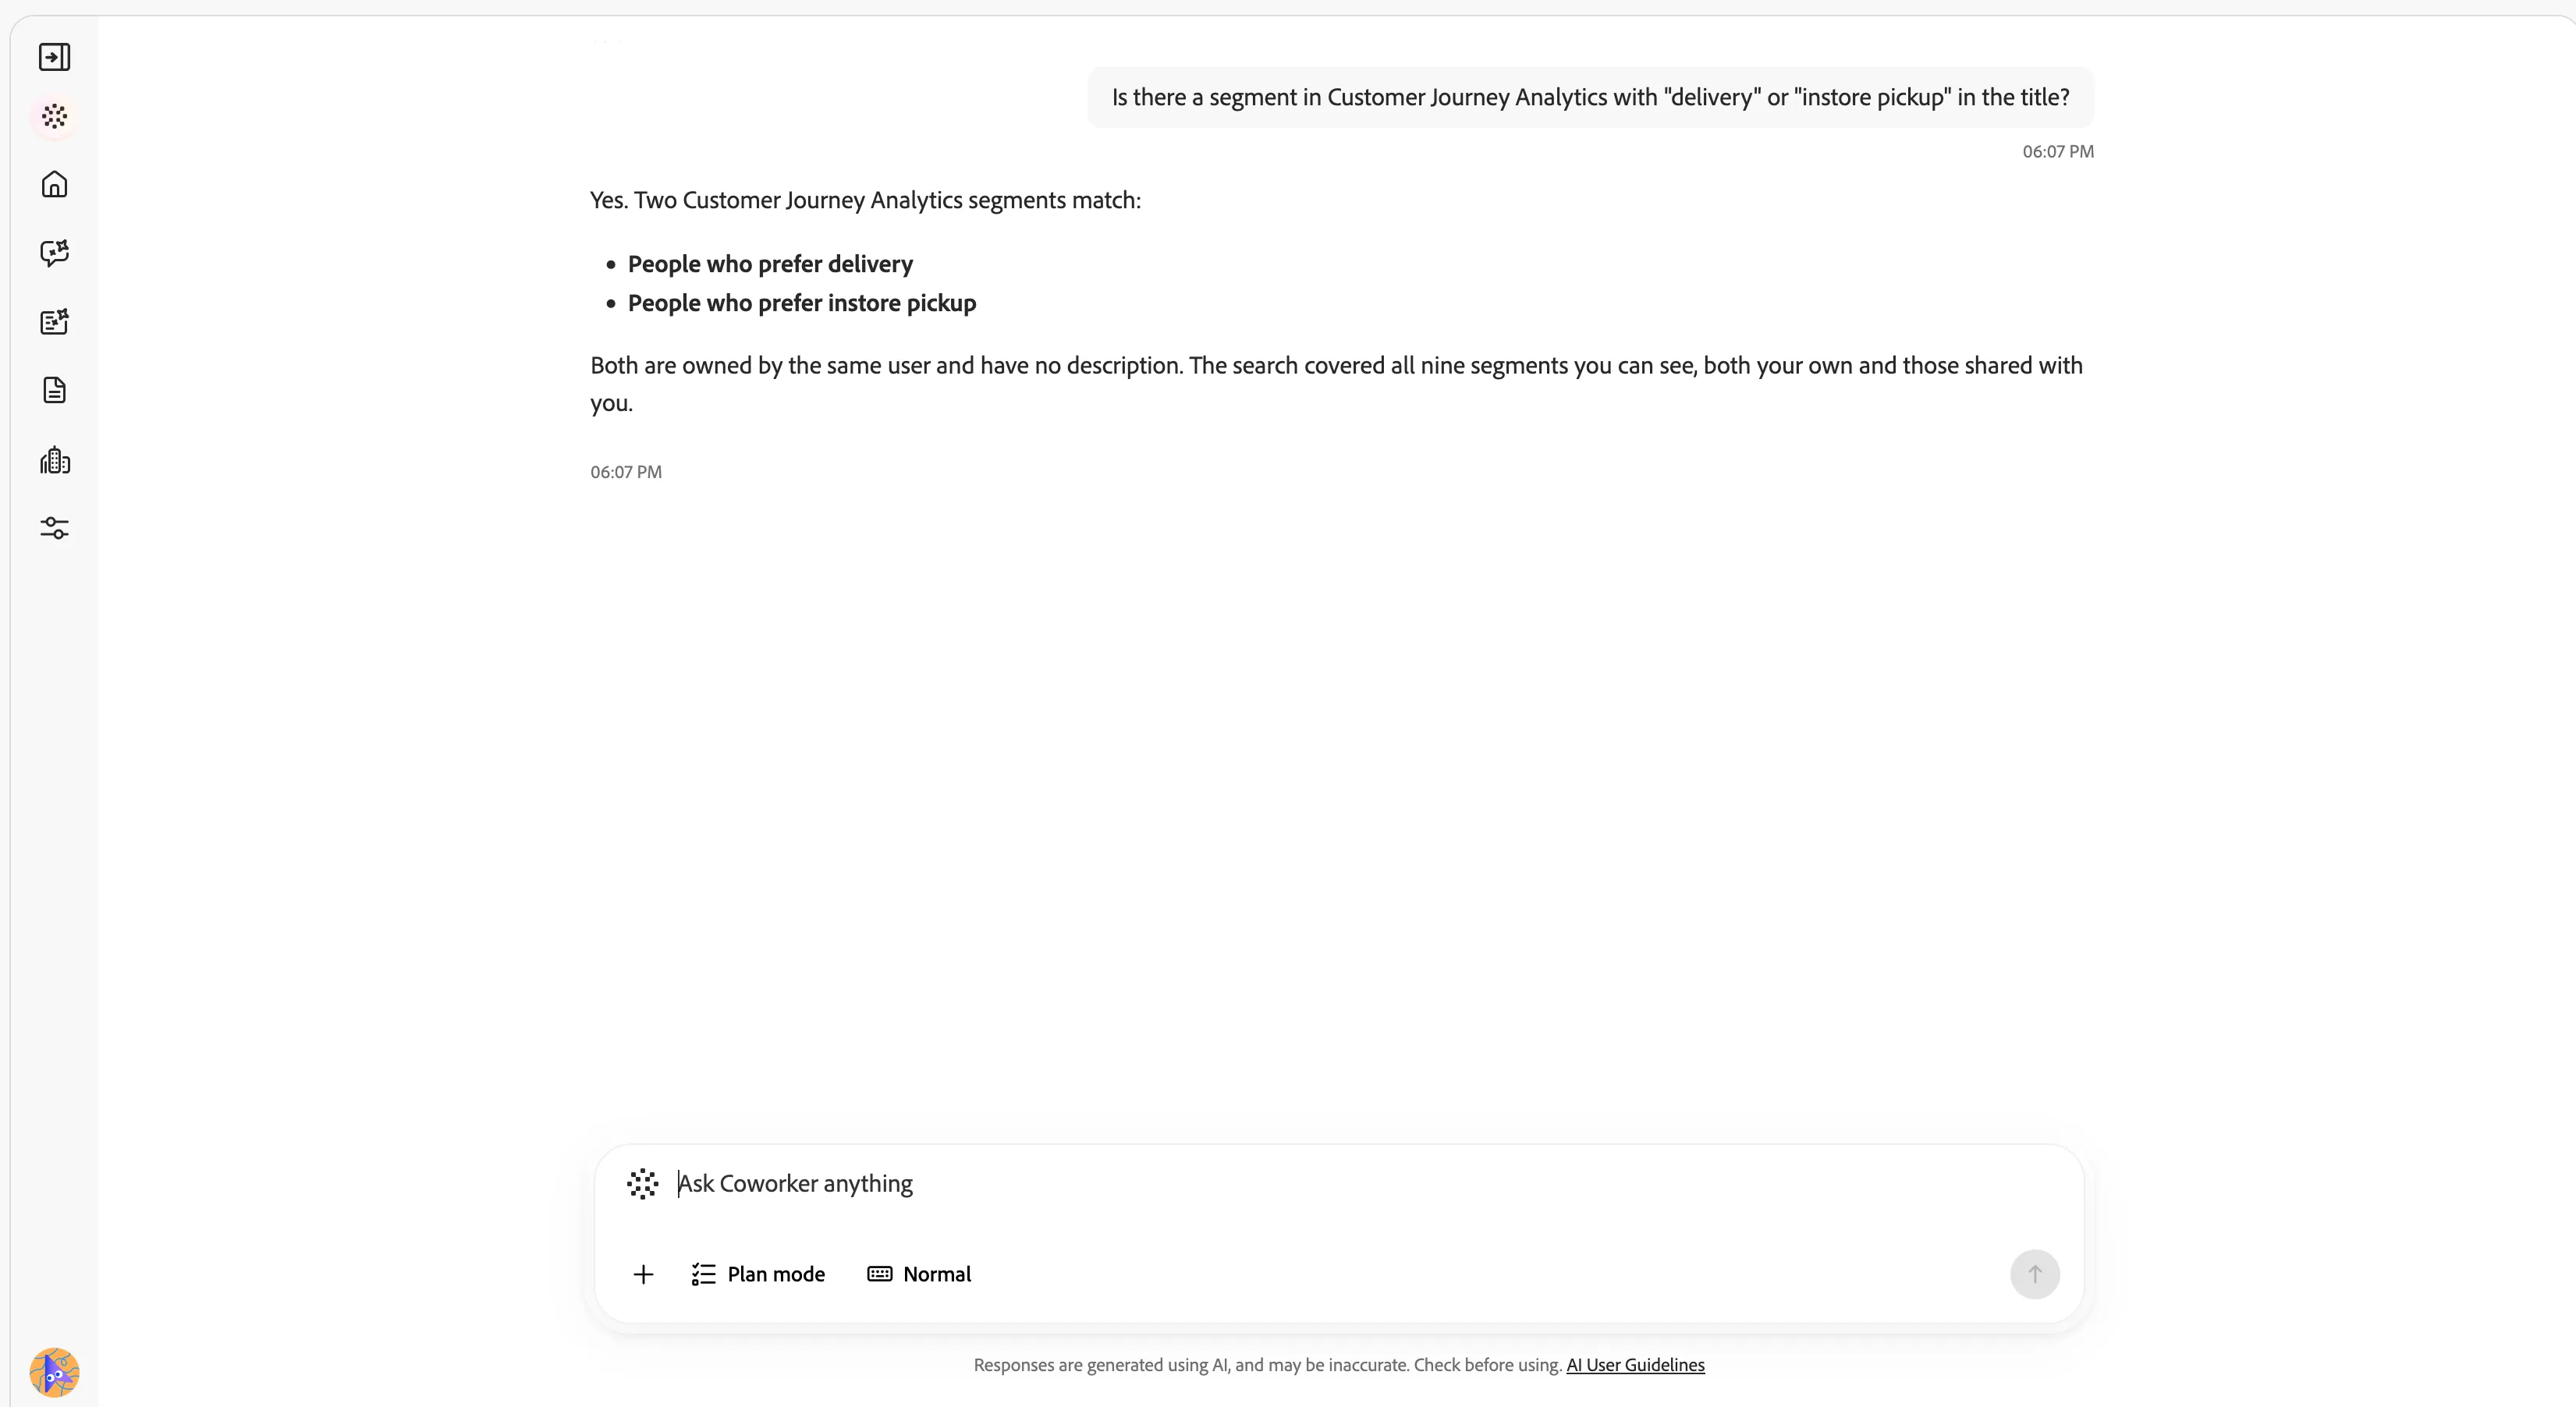
Luma already maintains segments for these two groups. Let's have Coworker find them.
Expected outcome: Coworker surfaces the two existing audiences, "People who prefer delivery" and "People who prefer instore pickup".
Now the core comparison.
Analyze purchase frequency over the last 60 days for the "People who prefer delivery" and "People who prefer instore pickup" segments.
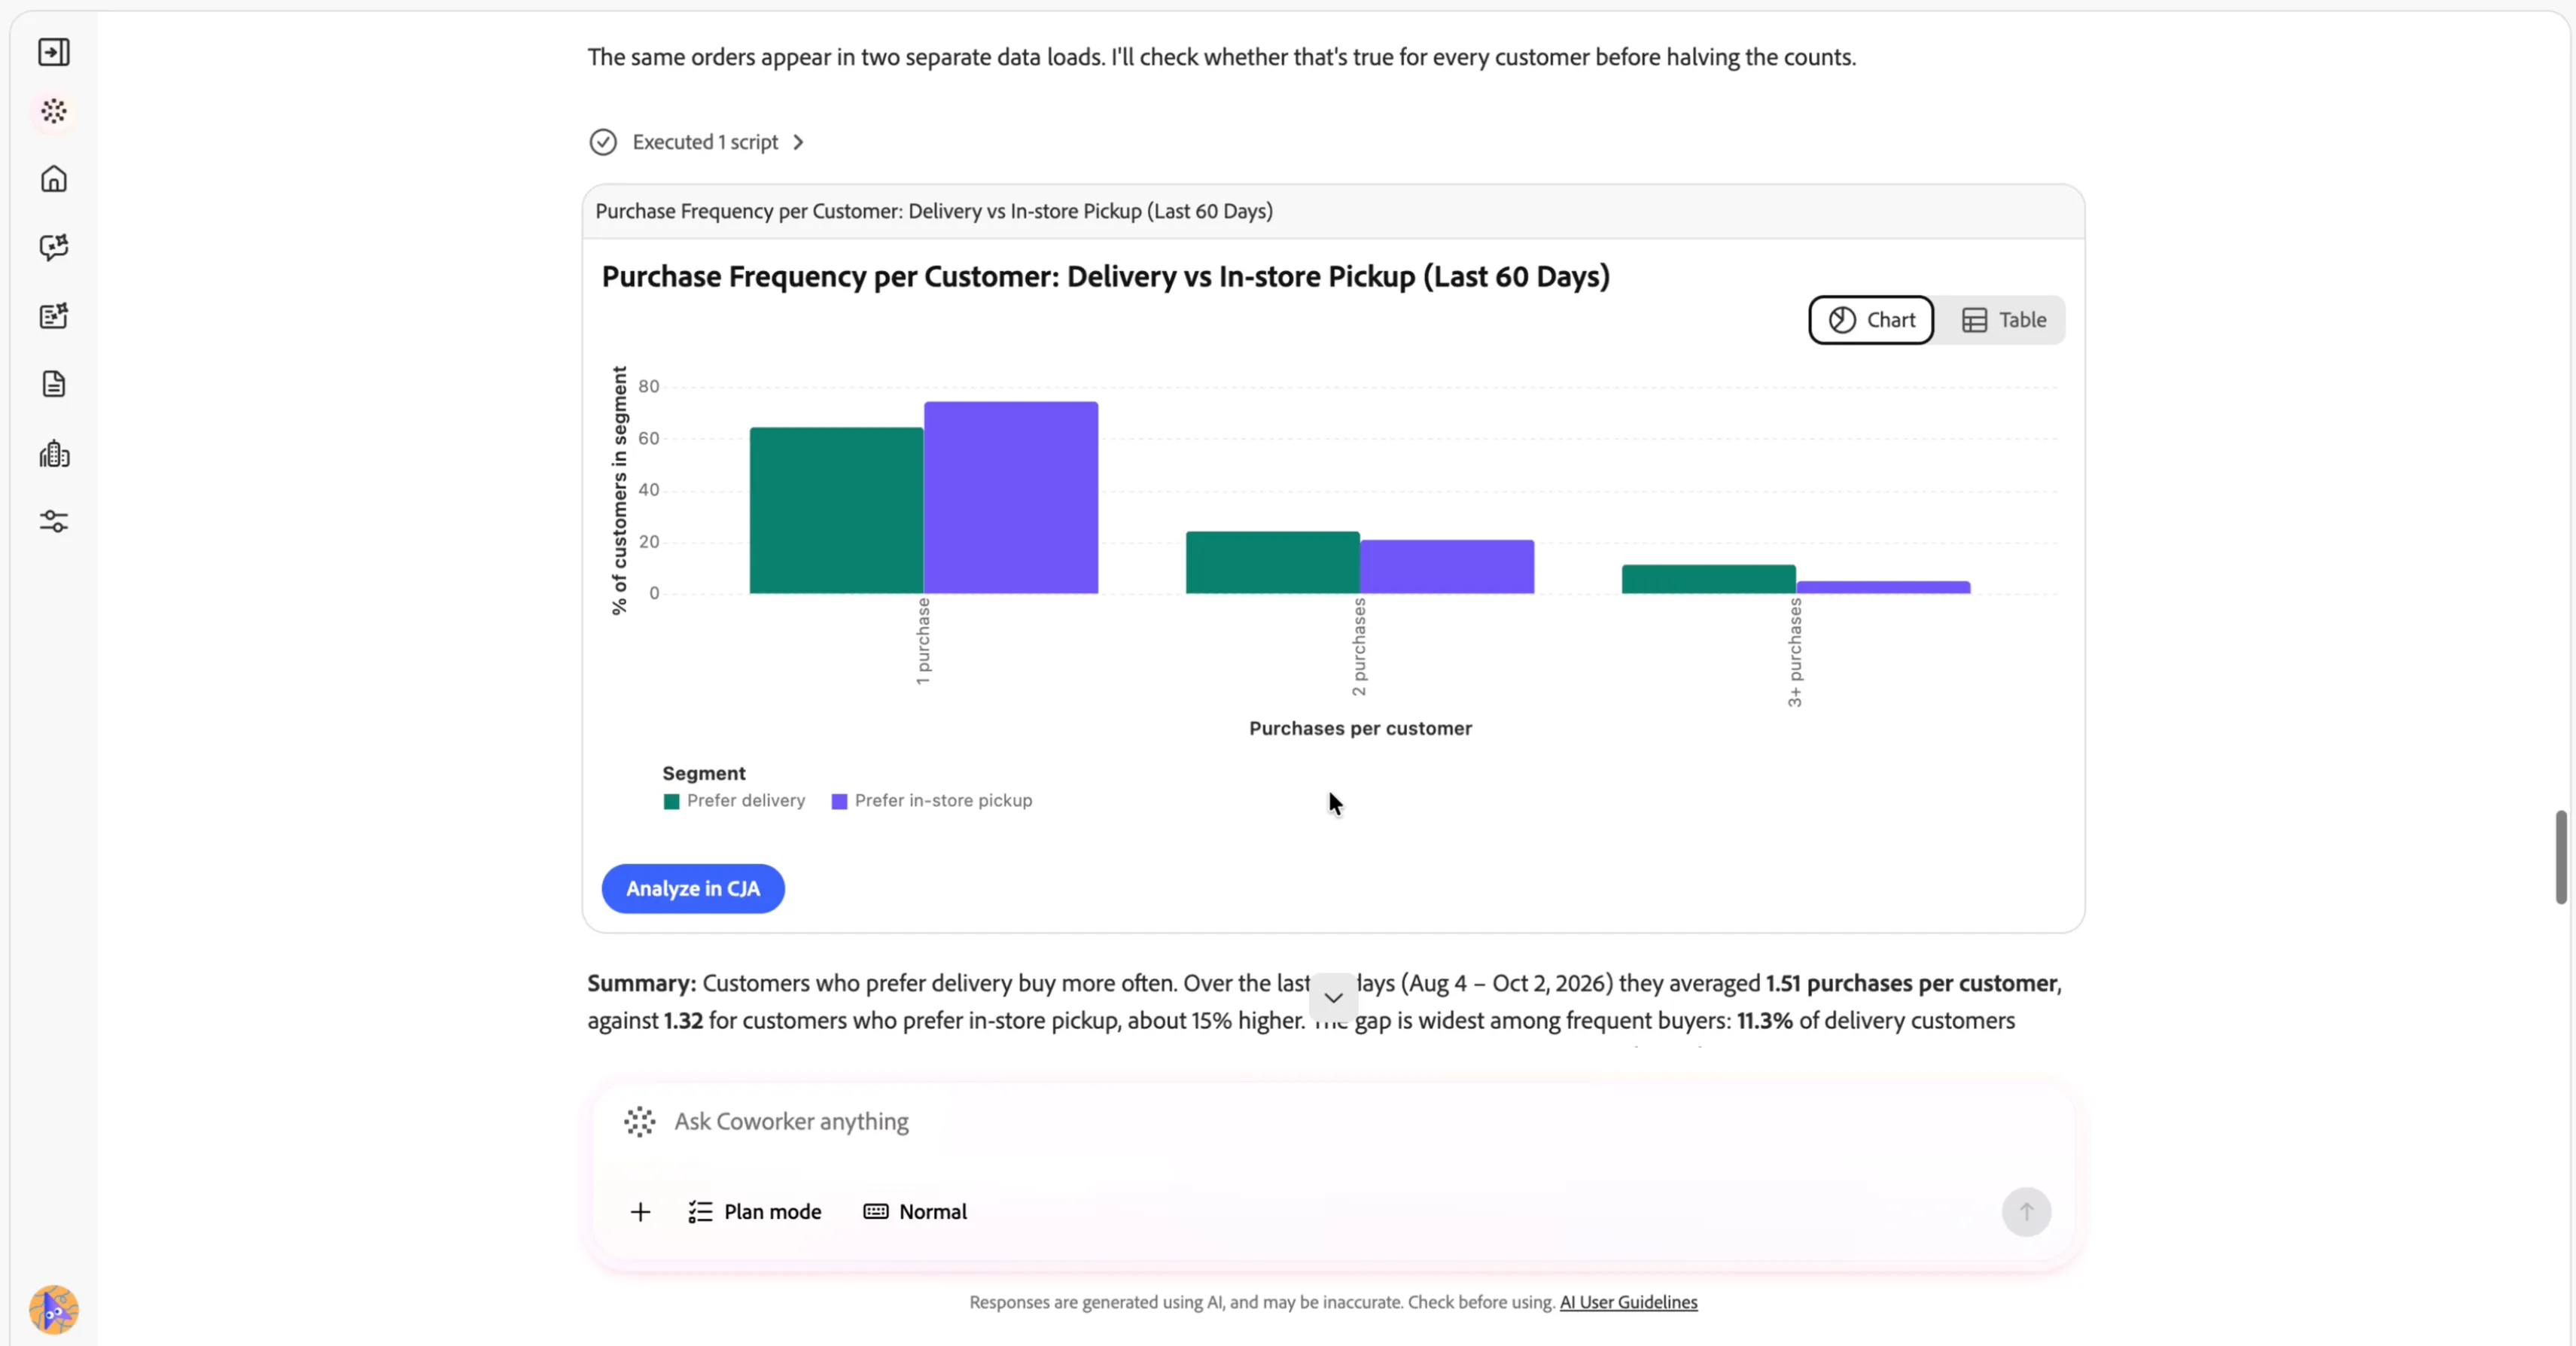
For each segment, calculate the number of purchases per customer within the 60-day window (e.g. distribution of 1 purchase, 2 purchases, 3+ purchases). Compare the two segments to identify which one shows higher purchase frequency.
Output required:
- A short written summary explaining which segment purchases more frequently and any notable pattern.
- A table showing the distribution of purchase counts per customer, per segment.
- A chart comparing purchase frequency distribution between the two segments.
Expected outcome: a written summary, a table, and a chart showing the distribution of purchase counts per customer (1, 2, 3+) for each segment. Delivery customers skew toward more purchases in the window; in-store pickup customers concentrate at the lower end. This gap is the justification for investing in the in-store pickup experience — which is exactly what you'll build in the next two exercises.
You've confirmed that in-store pickup customers purchase less frequently. Now that you've spotted this gap in the customer journey, you can act on it. Over the next exercises you'll orchestrate a series of communications to these customers — including targeted offers — designed to bring them back more often and grow revenue. You'll start by building the audience for that journey.