Order Frequency
IMPORTANT: numbers shown in this guide, including screenshots, may differ from your reports due to different underlying datasets.
Goals
- Understand how different groups of customers engage with your brand
- Measure engagement by frequency of repeat behaviours
Delivery vs InStore Pickup
Scenario: You're asked to analyse repeat purchasing behaviour to identify upsell and cross sell opportunities.
Task: Create a Cohort Visualisation to understand the average time between repeat orders. Compare whether fulfilment type has any impact on this behaviour.
Examples of what you can do with Cohort Analysis:
- Launch campaigns designed to spur a desired action.
- Shift marketing budget at exactly the right time in the customer lifecycle.
- Recognise when to end a trial or an offer, in order to maximise value.
- Gain ideas for A/B testing in areas such as pricing, upgrade path, and so on.
- Create a new panel below the last panel you just worked on, title it Order Frequency Analysis, ensure your date range is Last 30 days.
- Add a Cohort Table visualisation
The Cohort table configuration should look like this:
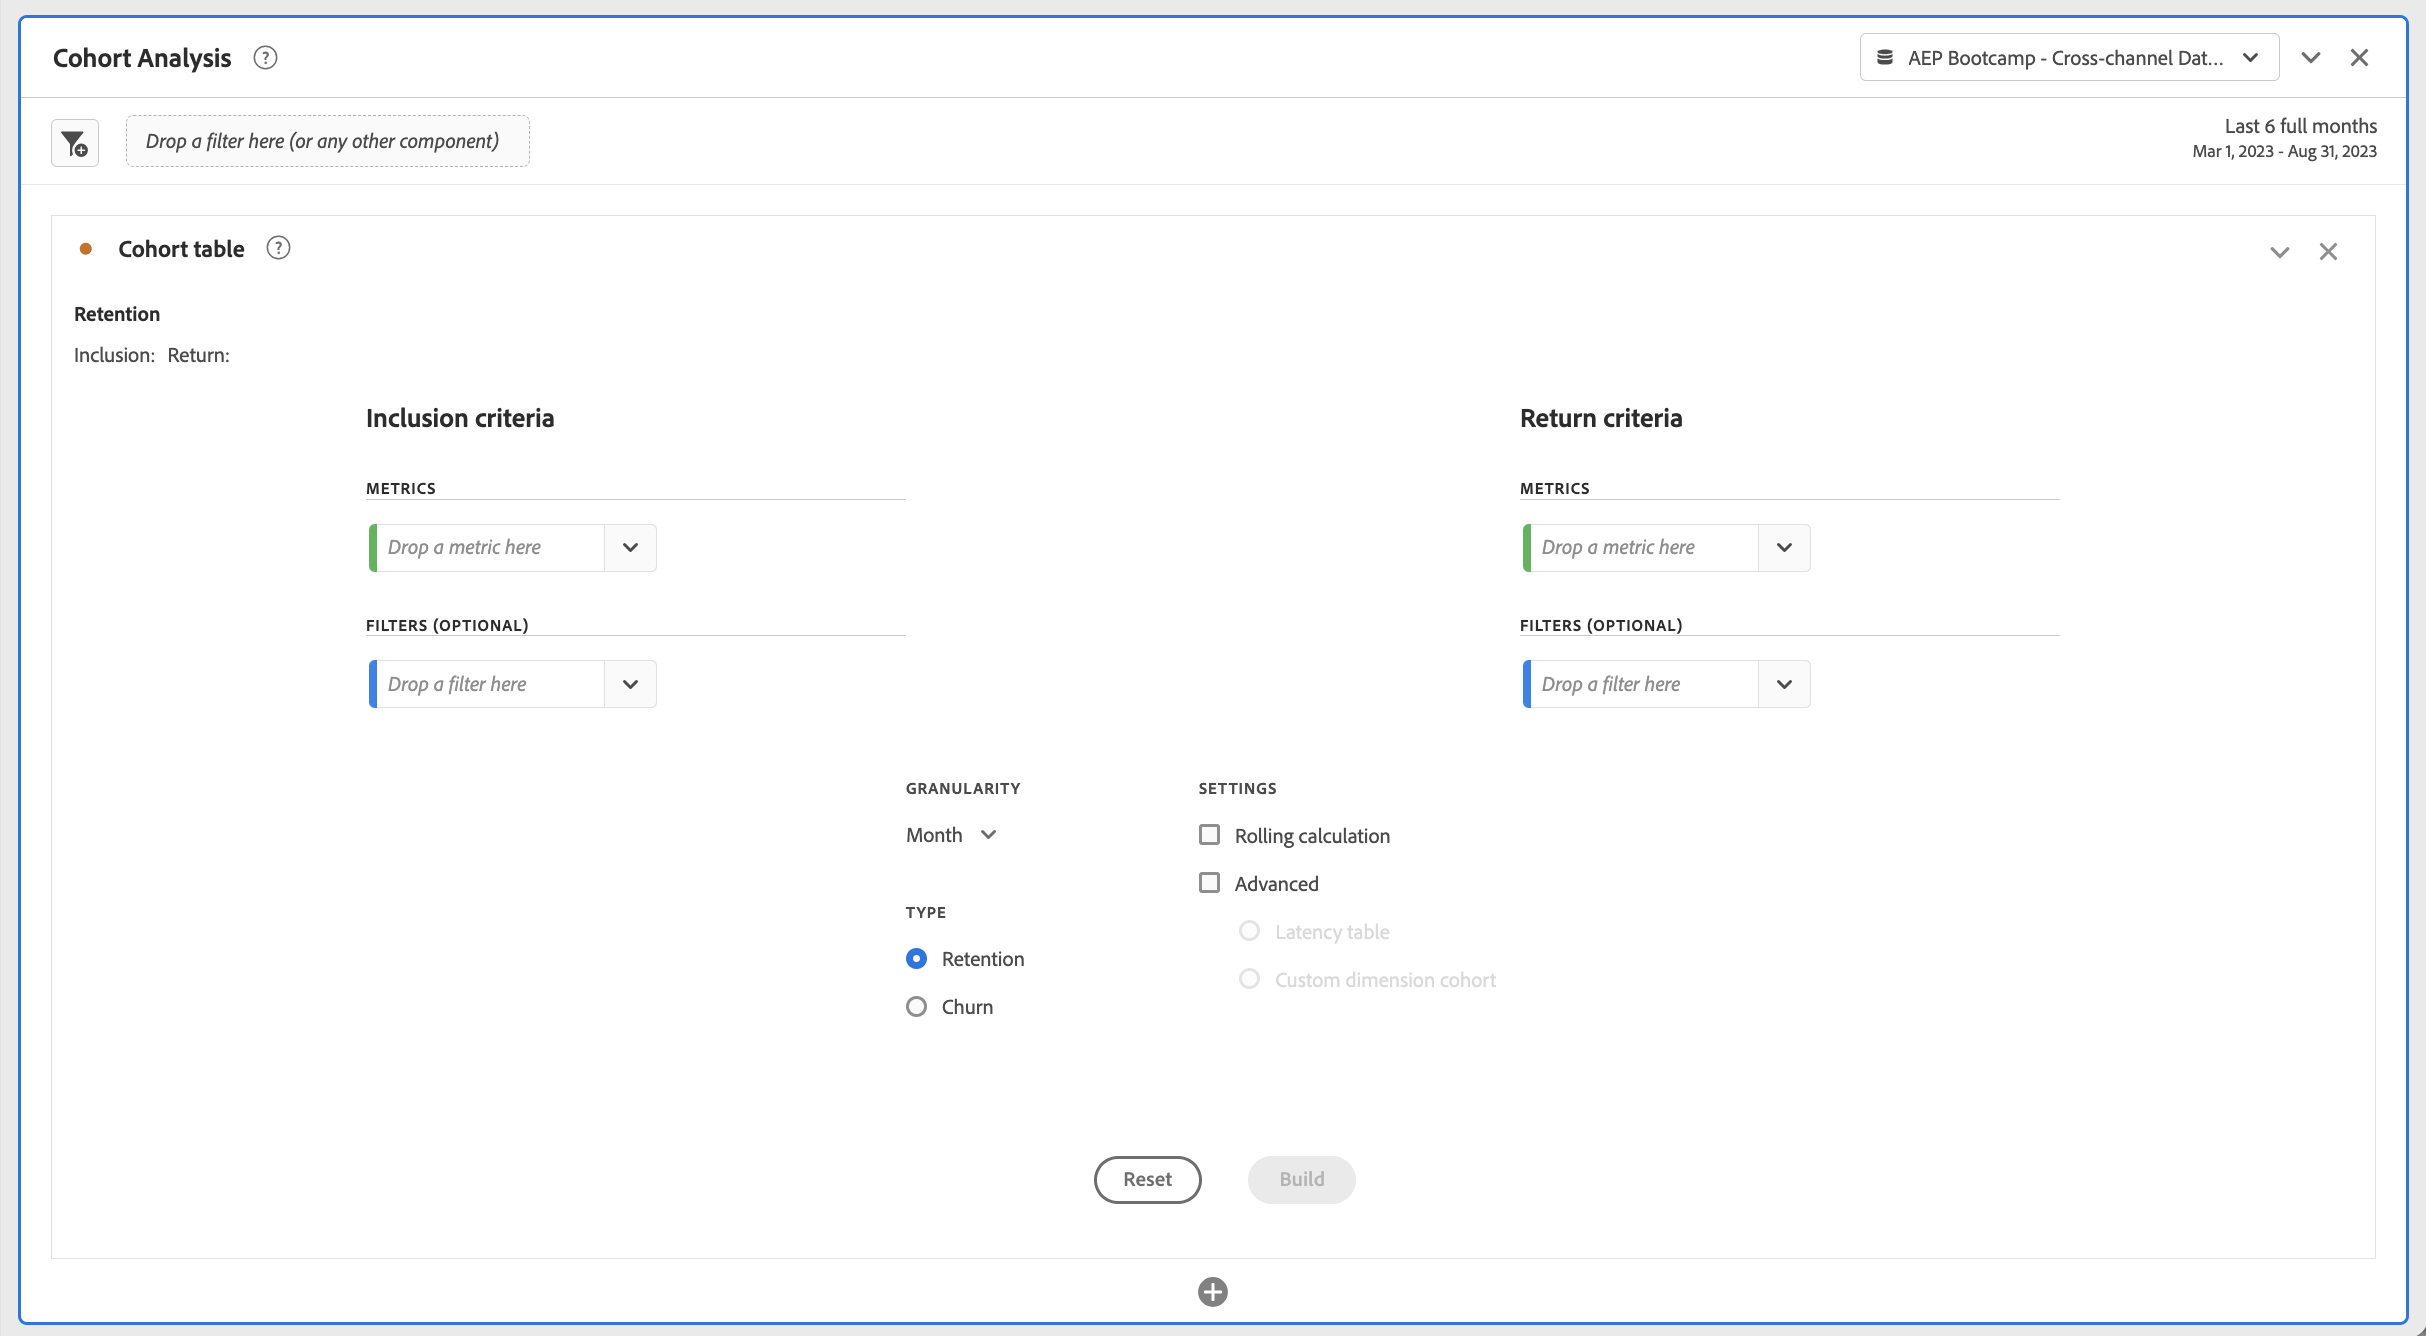
- The Inclusion Criteria allows you to set a metric as Day 0. Anyone that has this event will fall into Day 0. Filters can be applied to be very specific about the event criteria.
- The Return Criteria allows you to set a metric as the event that will happen in the future that you want to measure. Anyone that met the inclusion criteria and then meets the return criteria will be measured.
You can set different inclusion and exclusion criteria to understand the average lead time between actions for example - seeing an offer and making a purchase or a customer submitting a support request and an agent contacting them. In this case, analyse the same event to understand repeat behaviours.
- Set the Inclusion Criteria to
- Metrics: Total Orders
- Segments: People who prefer delivery
- Set the Return Criteria to be the same.
- Change the Granularity to Week
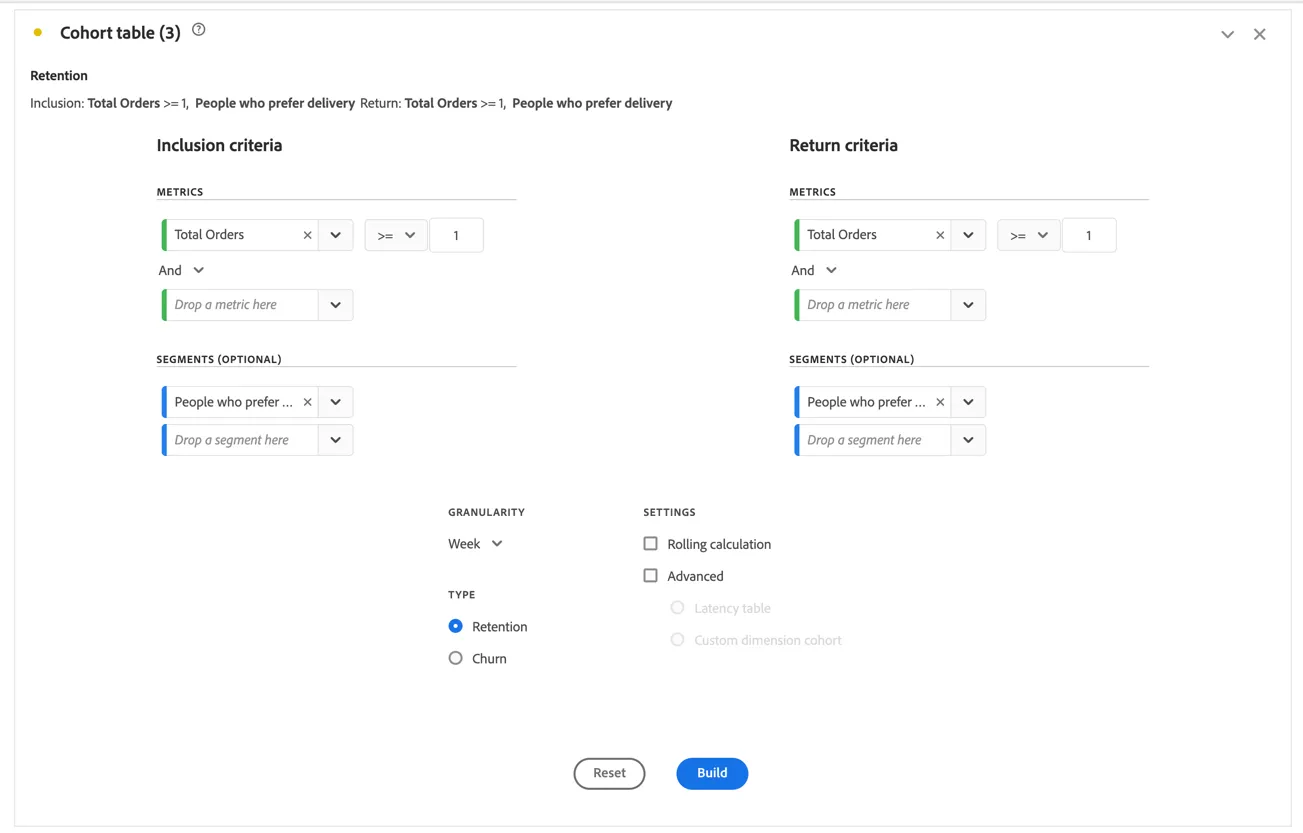
- Click to Build.
- Label your visualisation as Repeat Orders - Delivery.
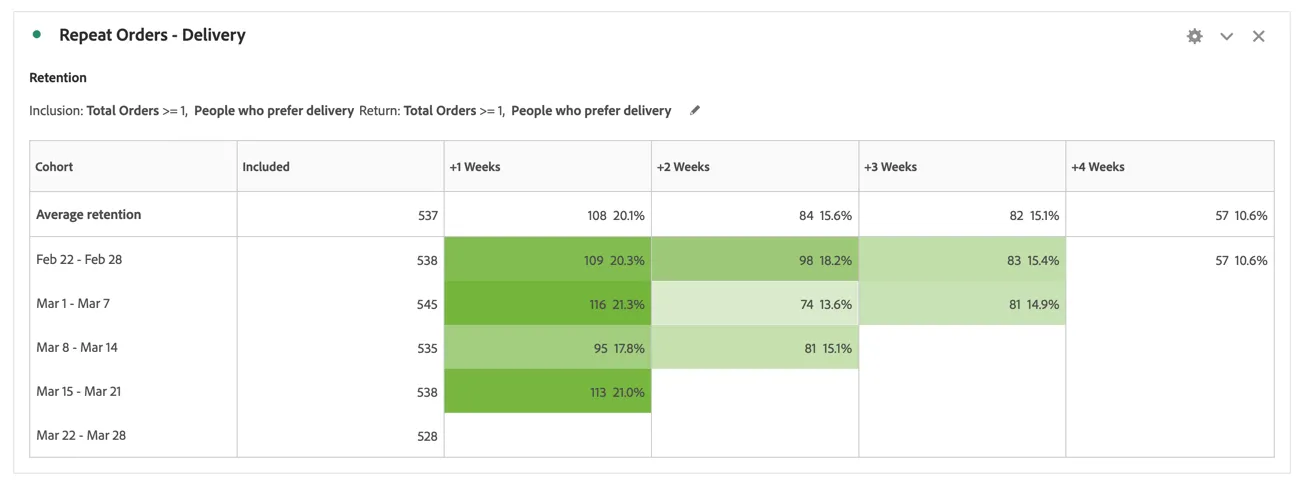
Now compare this cohort with customers who prefer to pick up in store.
- Add another cohort, this time adding customers who prefer instore pickup as the segment.
- label this cohort Repeat Orders - In store pick up
- Arrange the cohorts to appear side by side.
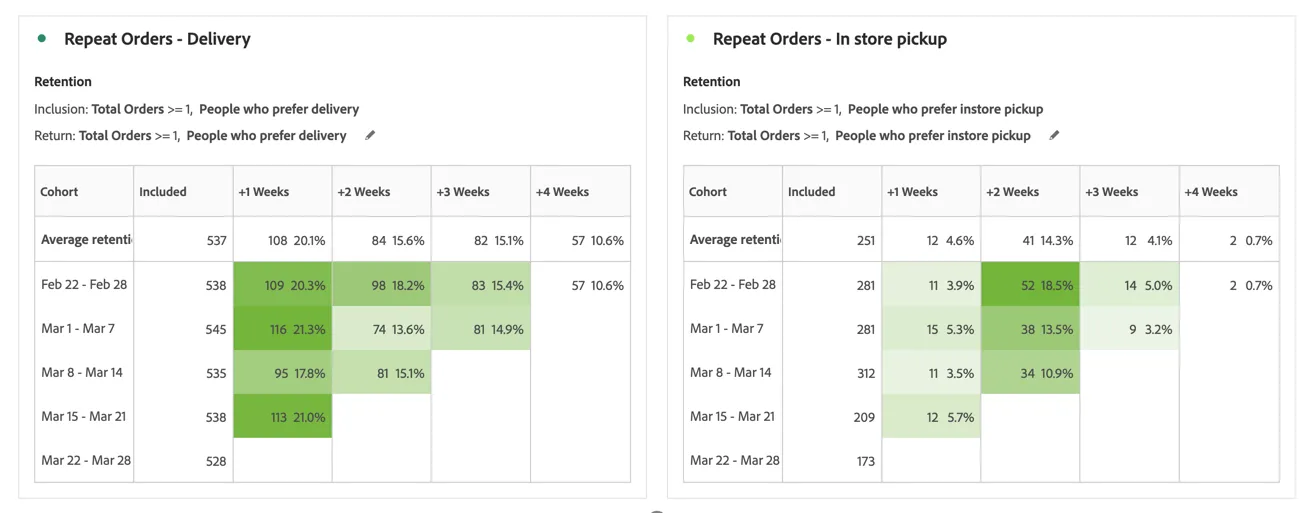
You can see that customers who prefer delivery are much more likely to order again within 1 week, while customers who pick up in store typically wait at least 2 weeks before purchasing again. This indicates an untapped commercial opportunity at the pickup stage of the journey.
Bonus: Guided Analyses
You can use one of CJA's Guided Analysis options to quickly group event data by how often events occur in your product (on your website, app or any channel).
You are using purchasing events in this case, but you could consider analysing the frequency of mobile app logins vs website logins or any other action you are expecting users to complete on a regular basis across your channels.
Congratulations, this completes the exercise on Cohorts!