Call Center Deflection
IMPORTANT: numbers shown in this guide, including screenshots, may differ from your reports due to different underlying datasets.
Goals
- Identify which digital pages are most strongly associated with inbound calls.
- Quantify the deflection opportunity.
In most cases people think of measuring the influence of marketing touches on driving conversions when talking about attribution. Attribution IQ supports this use case as seen in the previous exercise but it can also be used for many other use cases. When used in CJA, you can measure the influence that any data point has on driving an event of interest, for example, measure the influence of web pages on driving calls.
Building the Panel
Scenario: the customer operations team wants to know which digital pages are generating calls, and whether improving the digital experience on those pages could reduce contact centre volume. As an analyst, you have both page view data and call centre data available in the same workspace.
Task: Use Time Decay attribution to connect pages to calls.
- Create a new panel by clicking the
 icon at the bottom of the page, outside the panel. Label it Call Center Deflection.
- Add a new Freeform Table and label it Top Pages Driving Calls.
- Set the date range to Last 6 full months.
- Add Page Name as the dimension.
- Add Digital Sessions and Calls as metrics.
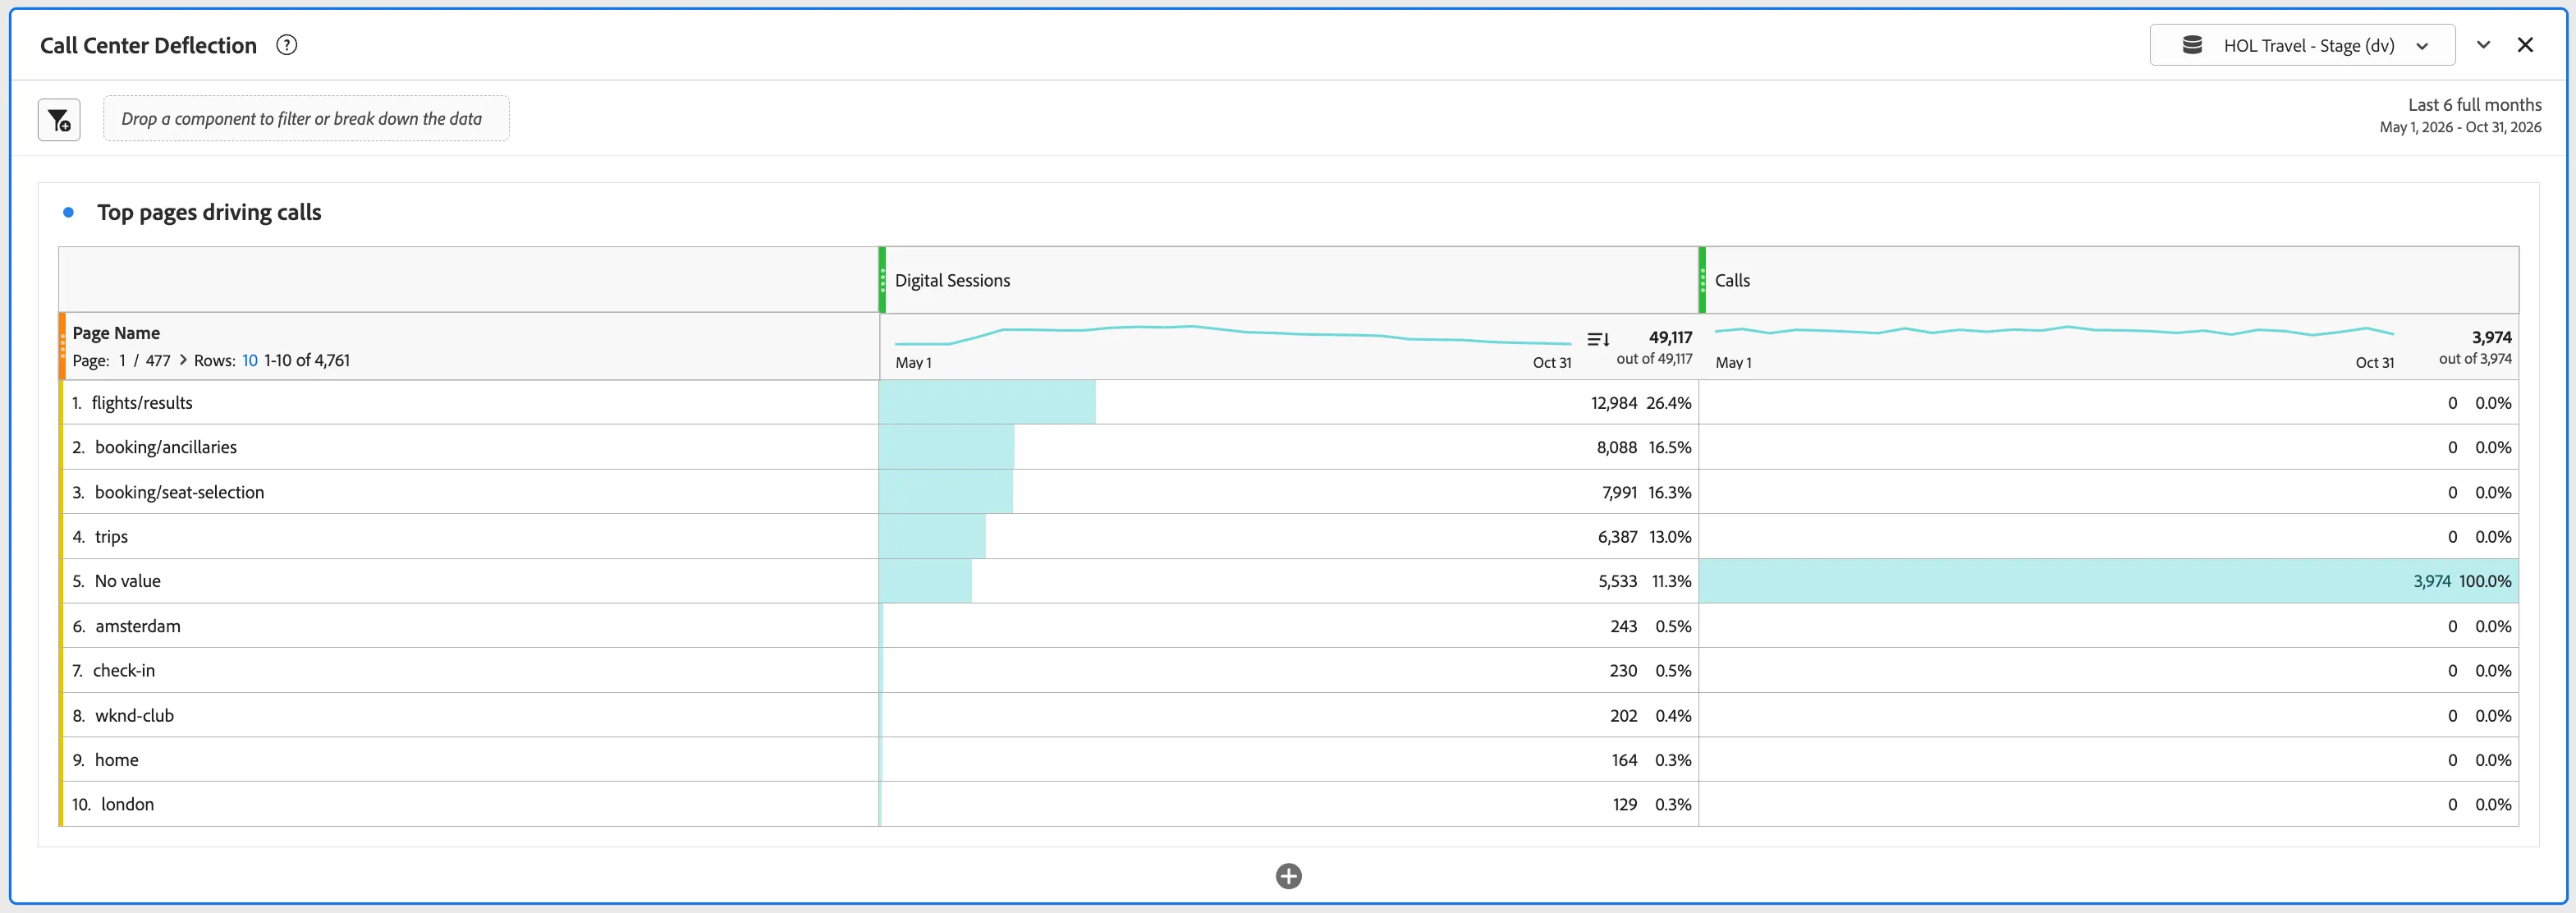
As expected, the “Calls” metric reports all 0's because there are no Call events that occur on the same event as a Page View.
- Apply Time Decay attribution to Calls
The calls metric counts how many calls happened. What it cannot tell you us which page preceded the call. Time Decay attribution assigns call credit to the pages a customer visited before calling, weighting the most recent pages most heavily.
- Right-click the Calls column header → Modify Attribution Model.
- Select the Time Decay model, Half-life = 1 day, Container = Person, Lookback window = Reporting window.
- Click Apply.
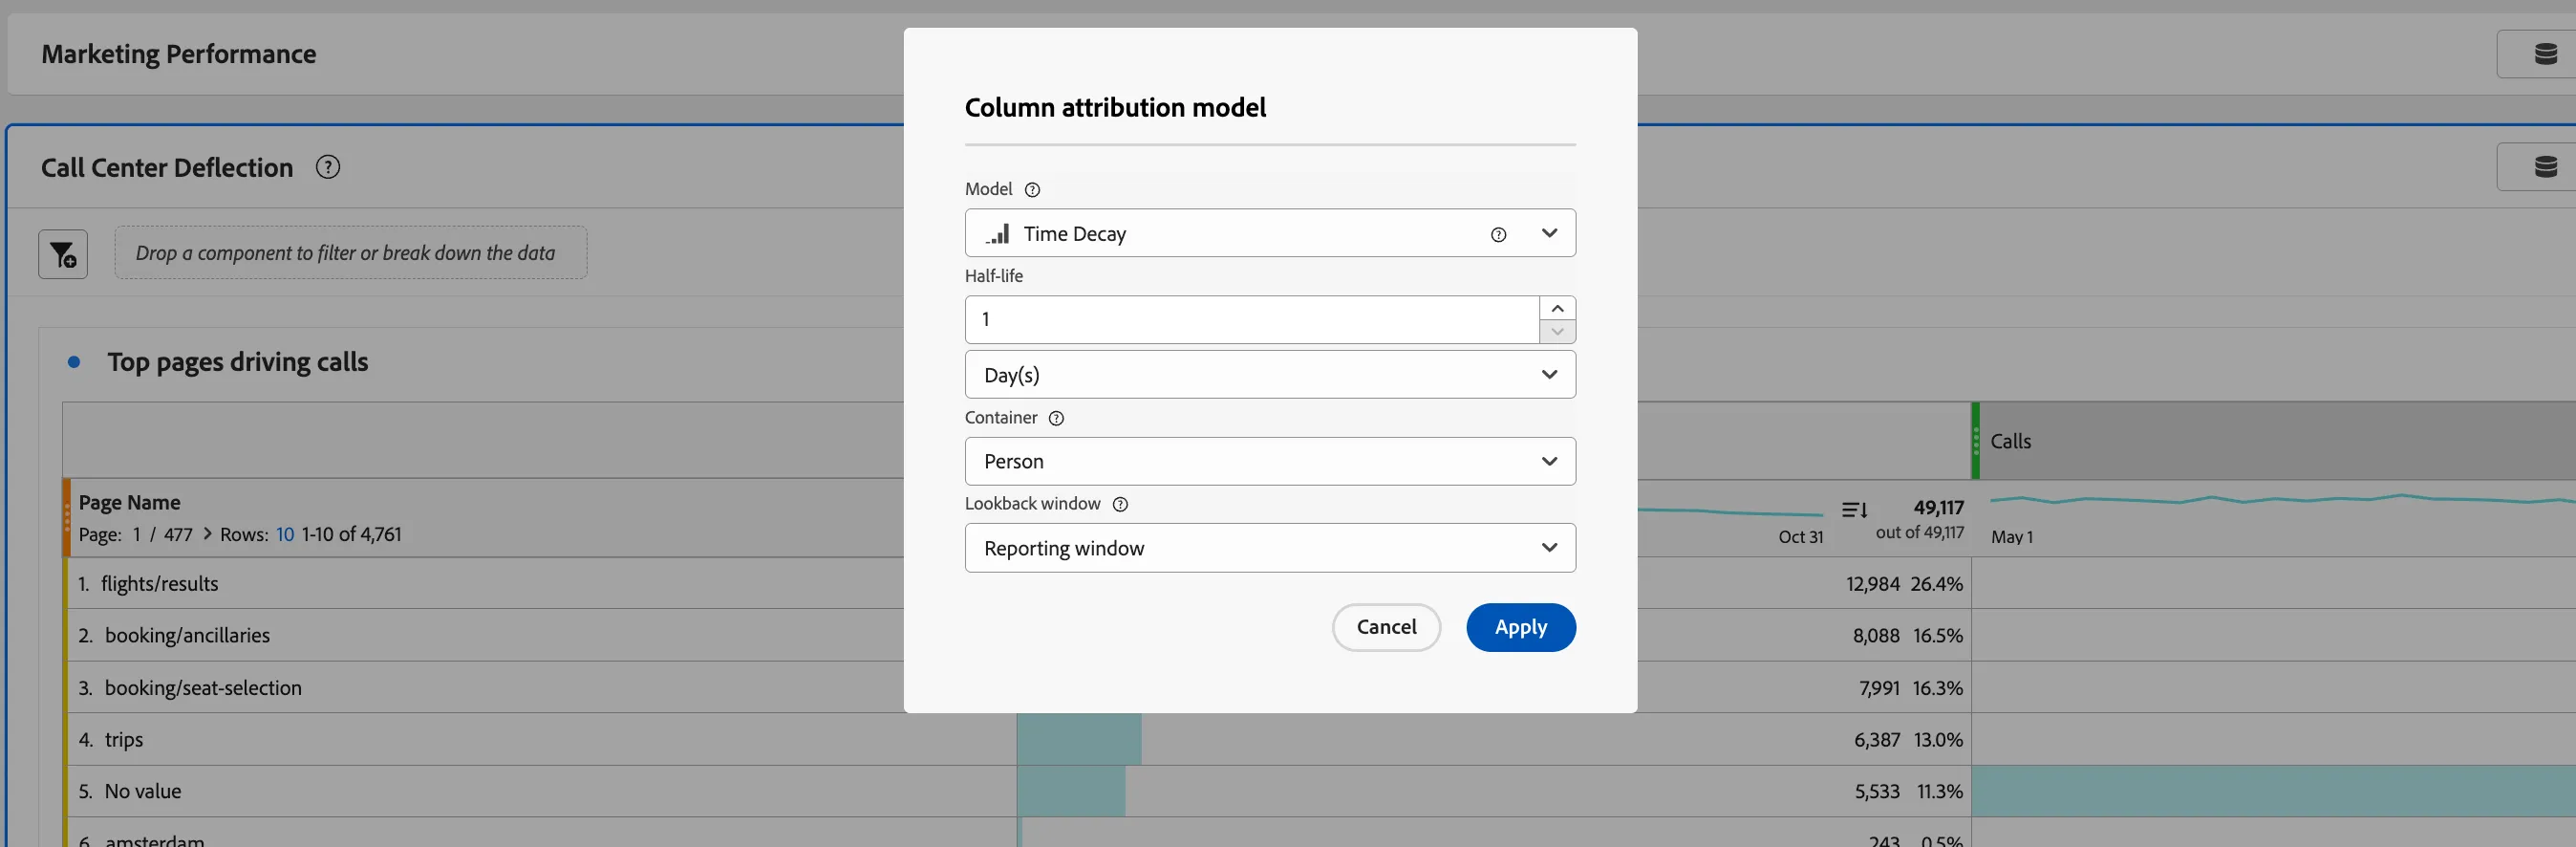
This is a perfect model for what you're trying to do. Typically, customers will try to do something online for a while before they give up and call into the call centre. This means that they may hit a couple of pages before they call. The goal is not to give credit only to the last page for driving the call, but more credit should go to the last page for driving the call.
The time decay model is configured to look back from the call event up to 1 day and give the most credit to the last page that a person saw prior to a call, and then incrementally less credit to each page behind that, up to 1 day prior to the call.
The resulting table:
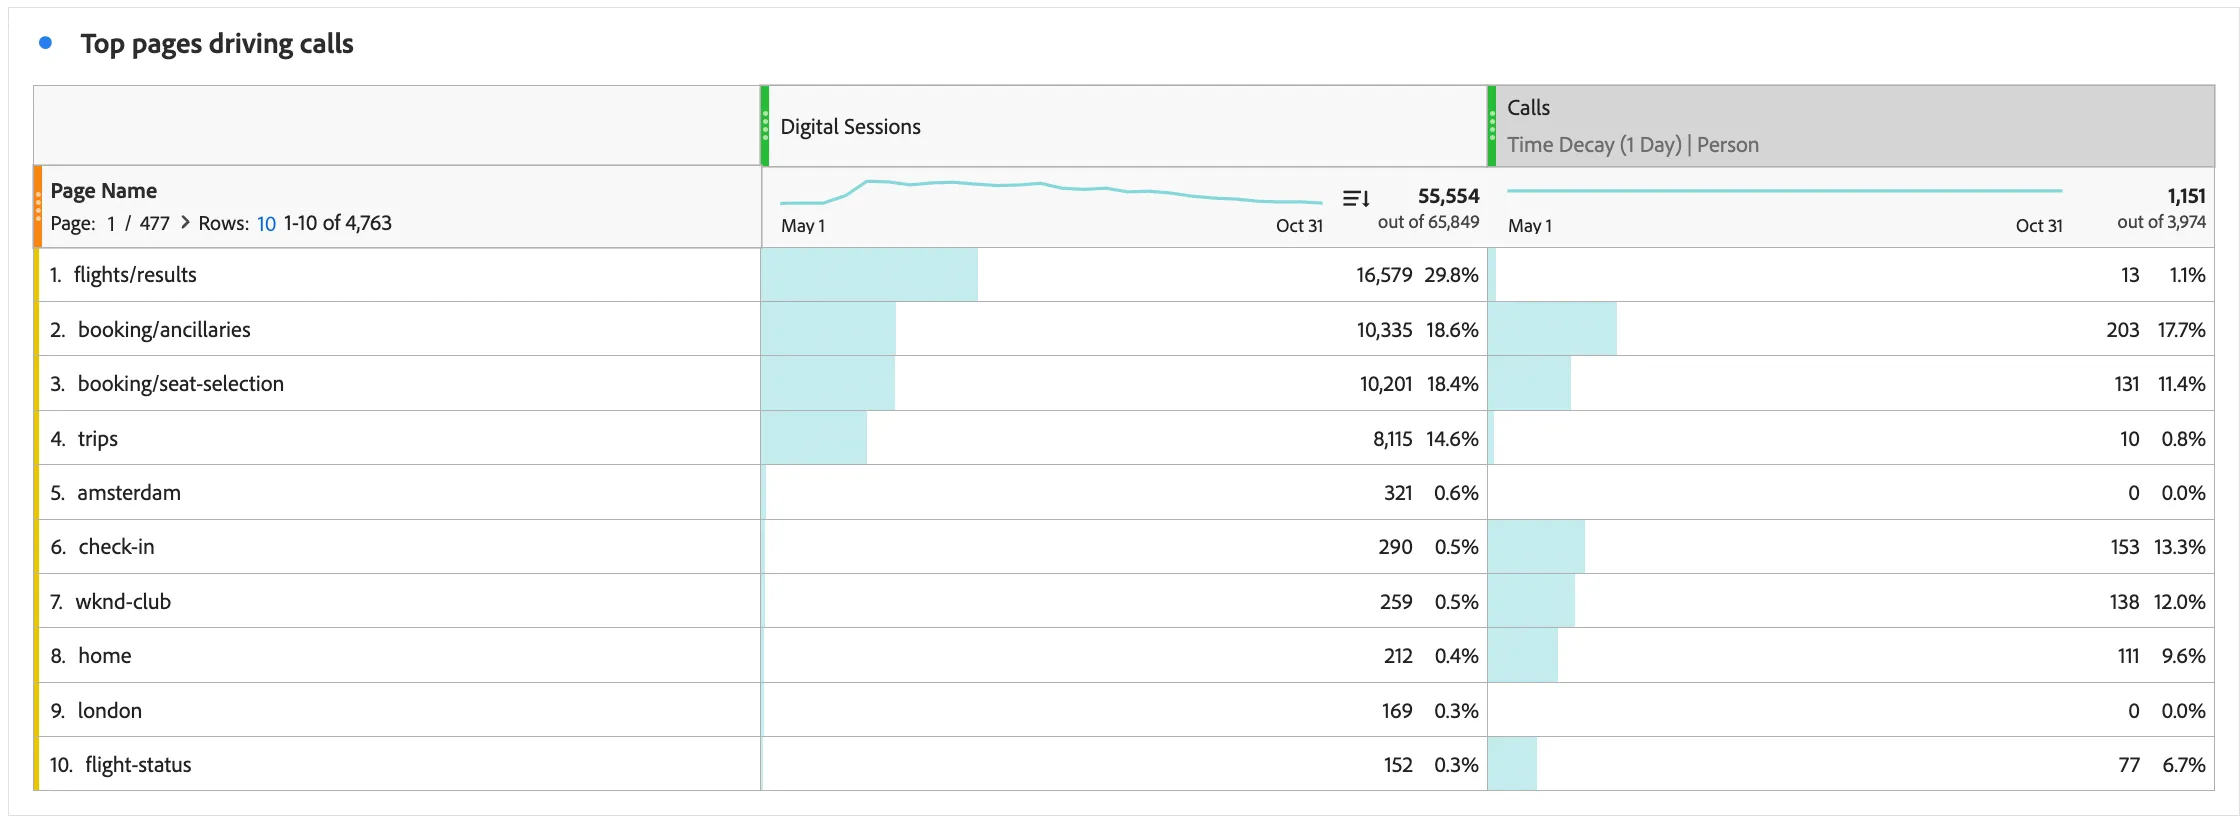
The page with the most traffic generates fewer calls. The pages where customers are understanding their baggage allowance, selecting a seat, or attempting to check in generate disproportionate call volumes.
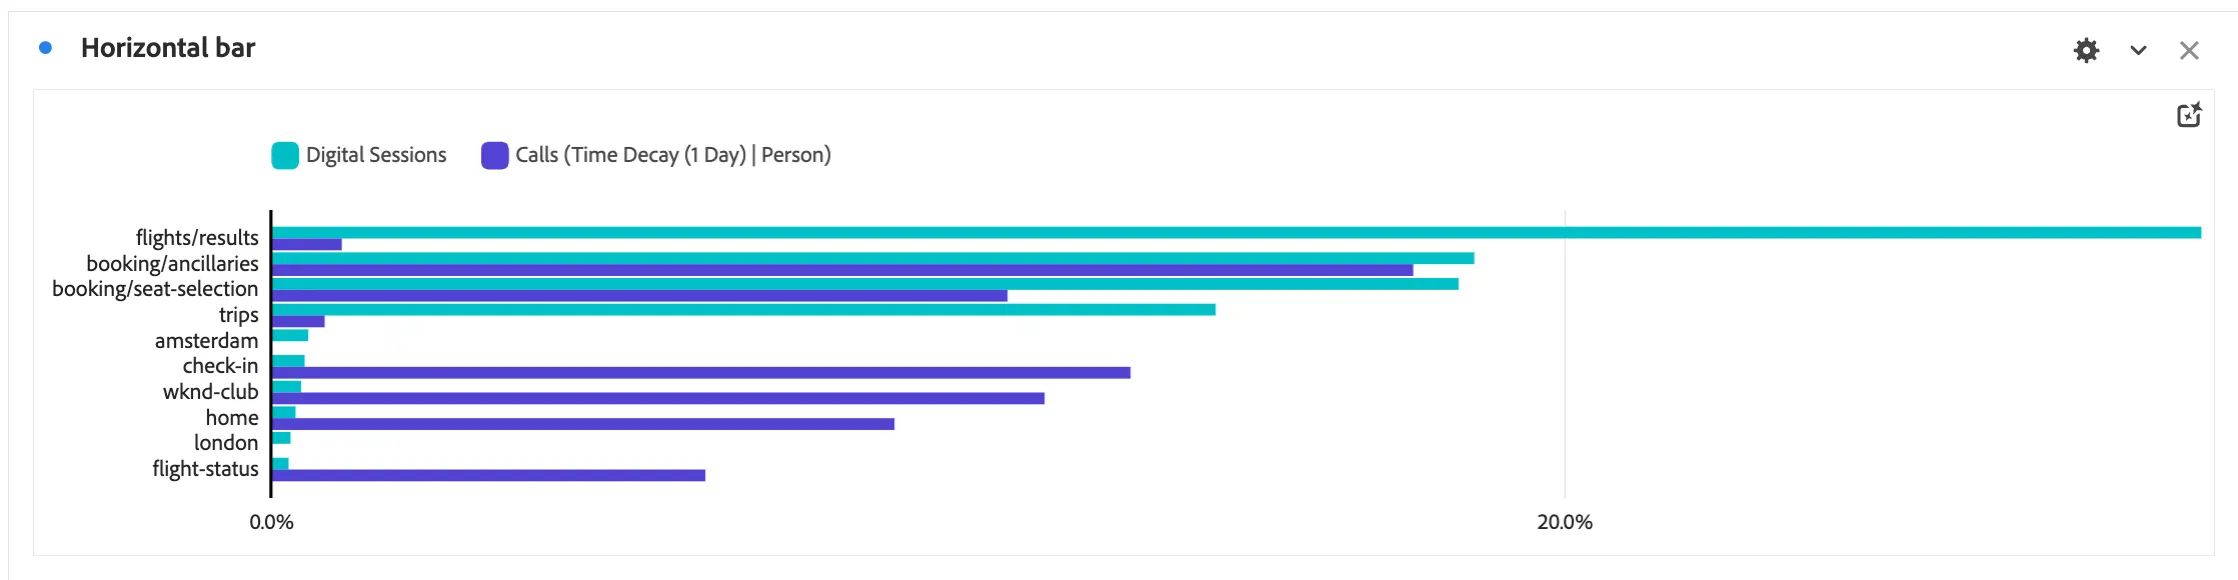
- Drag a Horizontal Bar visualisation above the freeform.
- In the visualisation settings, check the Percentages box
Now you can see which pages impact call volumes relative to the overall share. Check-in has 0.5% of the total Digital Sessions, but accounts for 13% of Calls.
Save your changes: Use Project > Save (or Cmd+S / Ctrl+S).
Marketers can now take action by testing different versions of those pages (Adobe Target is a great option here) until they find a version that works best at keeping people in the cheaper, online channel.
Congratulations, this completes the exercise on Attribution IQ!